| Param | Original file | Final file |
|---|---|---|
| Filename | modeM0/AS1A07_113T01_9000003526cztM0_level2_bc.evt | modeM0/AS1A07_113T01_9000003526cztM0_level2_quad_clean.evt |
| Size (bytes) | 13,198,440,960 | 3,066,537,600 |
| Size | 12.3 GB | 2.9 GB |
| Events in quadrant A | 49,678,624 | 19,798,163 |
| Events in quadrant B | 61,873,555 | 20,111,519 |
| Events in quadrant C | 50,564,681 | 19,725,520 |
| Events in quadrant D | 221,711,103 | 17,218,053 |
| Mode M9 | |||
|---|---|---|---|
| Quadrant | BADHDUFLAG | Total packets | Discarded packets |
| A | 0 | 331 | 0 |
| B | 0 | 331 | 0 |
| C | 0 | 331 | 0 |
| D | 0 | 331 | 0 |
| Mode SS | |||
|---|---|---|---|
| Quadrant | BADHDUFLAG | Total packets | Discarded packets |
| A | 0 | 4752 | 0 |
| B | 0 | 4752 | 0 |
| C | 0 | 4756 | 0 |
| D | 0 | 4752 | 0 |
| Mode M0 | |||
|---|---|---|---|
| Quadrant | BADHDUFLAG | Total packets | Discarded packets |
| A | 0 | 489581 | 0 |
| B | 0 | 542977 | 0 |
| C | 0 | 498590 | 0 |
| D | 0 | 1102703 | 0 |
| Quadrant | Total seconds | Saturated seconds | Saturation percentage |
|---|---|---|---|
| A | 233956 | 2453 | 1.048488% |
| B | 233991 | 8000 | 3.418935% |
| C | 233968 | 4290 | 1.833584% |
| D | 233698 | 62545 | 26.763173% |
Noise dominated data is calculated using 1-second bins in cleaned event files. If a bin has >2000 counts, and if more than 50% of those come from <1% of pixels, then it is considered to be noise-dominated and hence unusable.
| Quadrant | # 1 sec bins | Bins with >0 counts | Bins with >2000 counts | High rate bins dominated by noise | Noise dominated (total time) | Noise dominated (detector-on time) | Marked lightcurve |
|---|---|---|---|---|---|---|---|
| A | 314643 | 234093 | 0 | 0 | 0.00% | 0.00% |  |
| B | 314643 | 234101 | 265 | 265 | 0.08% | 0.11% |  |
| C | 314643 | 234093 | 11 | 11 | 0.00% | 0.00% |  |
| D | 314643 | 233838 | 12215 | 12215 | 3.88% | 5.22% |  |
Top three noisy pixels from each quadrant. If the there are fewer than three noisy pixels in the level2.evt file, extra rows are filled as -1
| Pixel properties | Quadrant properties | ||||||
|---|---|---|---|---|---|---|---|
| Quadrant | DetID | PixID | Counts | Sigma | Mean | Median | Sigma |
| A | 13 | 254 | 377401 | 132.56 | 12831 | 12628 | 2751.8 |
| A | 0 | 226 | 82371 | 25.34 | 12831 | 12628 | 2751.8 |
| A | 12 | 194 | 79700 | 24.37 | 12831 | 12628 | 2751.8 |
| B | 3 | 64 | 10416873 | 4327.78 | 12908 | 12615 | 2404.1 |
| B | 15 | 33 | 811324 | 332.23 | 12908 | 12615 | 2404.1 |
| B | 4 | 216 | 317731 | 126.92 | 12908 | 12615 | 2404.1 |
| C | 0 | 239 | 609031 | 201.95 | 12580 | 12574 | 2953.4 |
| C | 7 | 247 | 541025 | 178.93 | 12580 | 12574 | 2953.4 |
| C | 0 | 10 | 410483 | 134.73 | 12580 | 12574 | 2953.4 |
| D | 8 | 195 | 108792322 | 40350.68 | 11467 | 11089 | 2695.9 |
| D | 13 | 174 | 43048910 | 15964.2 | 11467 | 11089 | 2695.9 |
| D | 1 | 52 | 21955161 | 8139.81 | 11467 | 11089 | 2695.9 |
Histogram calculated using DETX and DETY for each event in the final _common_clean file
| Quadrant A | 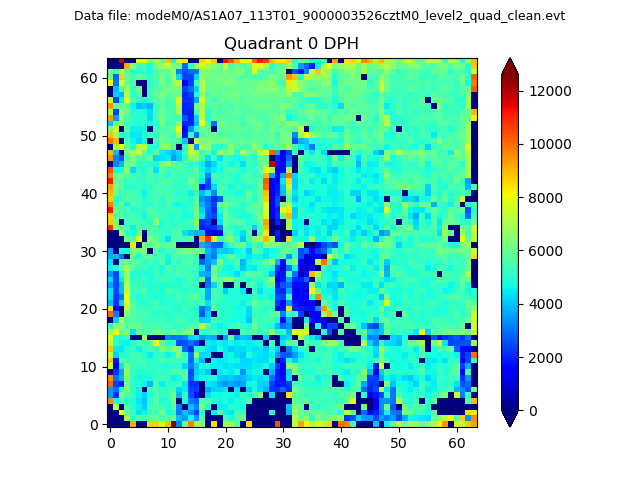 |
 |
Quadrant B |
|---|---|---|---|
| Quadrant D |  |
 |
Quadrant C |
| Plot type | Count rate plots | Images |
|---|---|---|
| Comparison with Poisson distribution Blue bars denote a histogram of data divided into 1 sec bins. Red curve is a Poisson curve with rate = median count rate of data. |
 |
 |
| Quadrant-wise count rates Data is divided into 100 sec bins |
 |
|
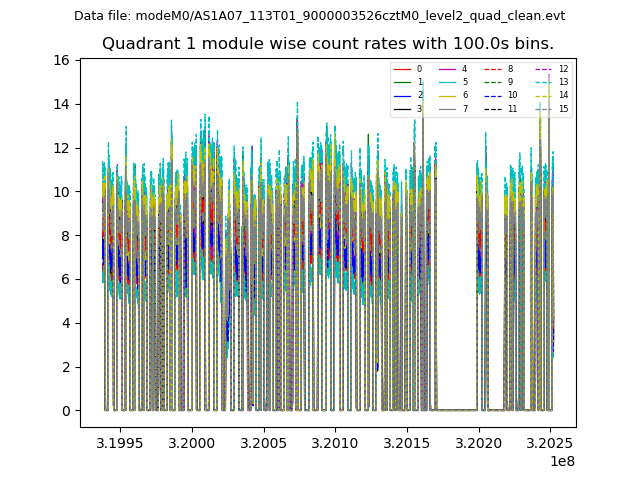
| Module-wise count rates for Quadrant A Data is divided into 100 sec bins |
 |
 |
| Module-wise count rates for Quadrant B Data is divided into 100 sec bins |
 |
 |
| Module-wise count rates for Quadrant C Data is divided into 100 sec bins |
 |
 |
| Module-wise count rates for Quadrant D Data is divided into 100 sec bins |
 |
 |
| Parameter | Plot |
|---|---|
| CZT HV Monitor |  |
| D_VDD | 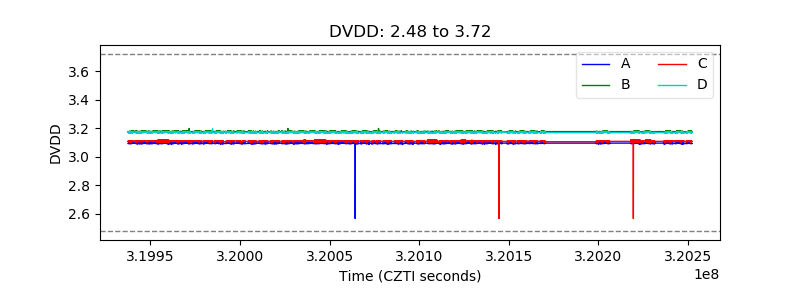 |
| Temperature 1 |  |
| Veto HV Monitor | 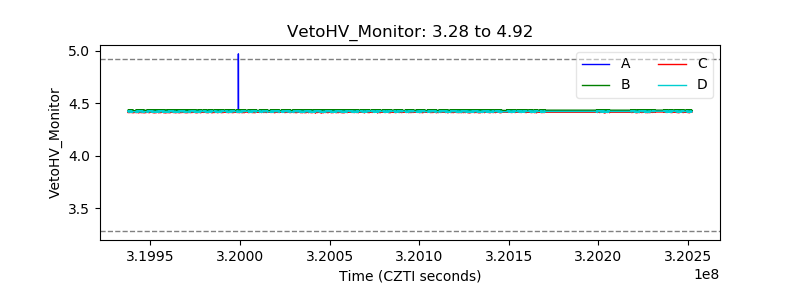 |
| Veto LLD | 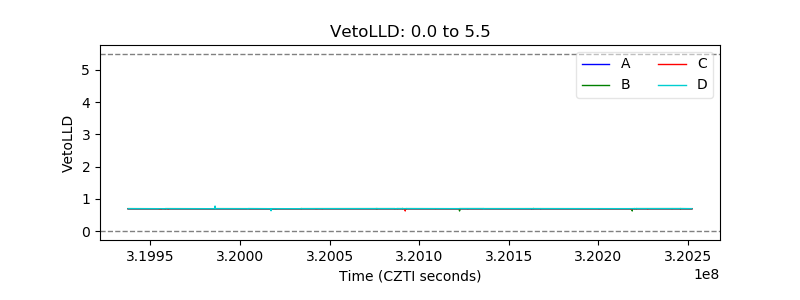 |
| Alpha Counter |  |
| _CPM_Rate |  |
| CZT Counter |  |
| +2.5 Volts monitor |  |
| +5 Volts monitor | 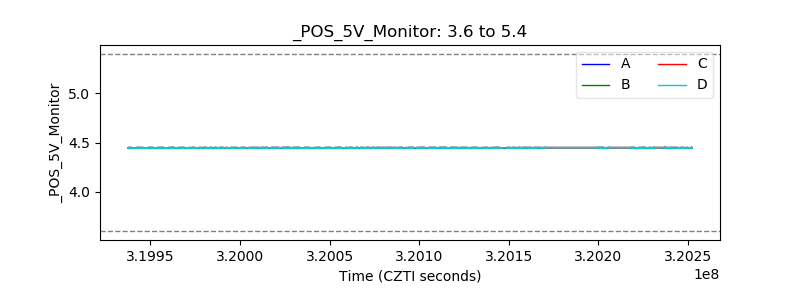 |
| _ROLL_ROT |  |
| _Roll_DEC |  |
| _Roll_RA |  |
| Veto Counter |  |