| Param | Original file | Final file |
|---|---|---|
| Filename | modeM0/AS1T03_180T01_9000003524cztM0_level2_bc.evt | modeM0/AS1T03_180T01_9000003524cztM0_level2_quad_clean.evt |
| Size (bytes) | 2,888,297,280 | 1,047,712,320 |
| Size | 2.7 GB | 999.2 MB |
| Events in quadrant A | 16,570,762 | 6,708,790 |
| Events in quadrant B | 19,056,610 | 6,821,205 |
| Events in quadrant C | 16,352,198 | 6,571,060 |
| Events in quadrant D | 30,242,909 | 6,349,464 |
| Mode M0 | |||
|---|---|---|---|
| Quadrant | BADHDUFLAG | Total packets | Discarded packets |
| A | 0 | 161596 | 0 |
| B | 0 | 170068 | 0 |
| C | 0 | 162347 | 0 |
| D | 0 | 203352 | 0 |
| Mode SS | |||
|---|---|---|---|
| Quadrant | BADHDUFLAG | Total packets | Discarded packets |
| A | 0 | 1570 | 0 |
| B | 0 | 1570 | 0 |
| C | 0 | 1570 | 0 |
| D | 0 | 1570 | 0 |
| Mode M9 | |||
|---|---|---|---|
| Quadrant | BADHDUFLAG | Total packets | Discarded packets |
| A | 0 | 127 | 0 |
| B | 0 | 127 | 0 |
| C | 0 | 127 | 0 |
| D | 0 | 127 | 0 |
| Quadrant | Total seconds | Saturated seconds | Saturation percentage |
|---|---|---|---|
| A | 77066 | 950 | 1.232710% |
| B | 77066 | 1644 | 2.133236% |
| C | 77066 | 1431 | 1.856850% |
| D | 77066 | 1997 | 2.591285% |
Noise dominated data is calculated using 1-second bins in cleaned event files. If a bin has >2000 counts, and if more than 50% of those come from <1% of pixels, then it is considered to be noise-dominated and hence unusable.
| Quadrant | # 1 sec bins | Bins with >0 counts | Bins with >2000 counts | High rate bins dominated by noise | Noise dominated (total time) | Noise dominated (detector-on time) | Marked lightcurve |
|---|---|---|---|---|---|---|---|
| A | 89166 | 77061 | 0 | 0 | 0.00% | 0.00% |  |
| B | 89166 | 77055 | 80 | 80 | 0.09% | 0.10% |  |
| C | 89166 | 77058 | 0 | 0 | 0.00% | 0.00% |  |
| D | 89166 | 77056 | 294 | 294 | 0.33% | 0.38% |  |
Top three noisy pixels from each quadrant. If the there are fewer than three noisy pixels in the level2.evt file, extra rows are filled as -1
| Pixel properties | Quadrant properties | ||||||
|---|---|---|---|---|---|---|---|
| Quadrant | DetID | PixID | Counts | Sigma | Mean | Median | Sigma |
| A | 13 | 254 | 129766 | 136.89 | 4277 | 4217 | 917.2 |
| A | 0 | 226 | 27564 | 25.46 | 4277 | 4217 | 917.2 |
| A | 12 | 194 | 26707 | 24.52 | 4277 | 4217 | 917.2 |
| B | 3 | 64 | 1107401 | 1378.81 | 4321 | 4234 | 800.1 |
| B | 0 | 189 | 418642 | 517.96 | 4321 | 4234 | 800.1 |
| B | 0 | 229 | 345273 | 426.25 | 4321 | 4234 | 800.1 |
| C | 0 | 10 | 187202 | 187.64 | 4146 | 4145 | 975.6 |
| C | 7 | 247 | 166817 | 166.75 | 4146 | 4145 | 975.6 |
| C | 4 | 175 | 33948 | 30.55 | 4146 | 4145 | 975.6 |
| D | 8 | 195 | 5130643 | 5283.34 | 4187 | 4052 | 970.3 |
| D | 7 | 238 | 3441752 | 3542.81 | 4187 | 4052 | 970.3 |
| D | 1 | 52 | 3249281 | 3344.45 | 4187 | 4052 | 970.3 |
Histogram calculated using DETX and DETY for each event in the final _common_clean file
| Quadrant A |  |
 |
Quadrant B |
|---|---|---|---|
| Quadrant D |  |
 |
Quadrant C |
| Plot type | Count rate plots | Images |
|---|---|---|
| Comparison with Poisson distribution Blue bars denote a histogram of data divided into 1 sec bins. Red curve is a Poisson curve with rate = median count rate of data. |
 |
 |
| Quadrant-wise count rates Data is divided into 100 sec bins |
 |
|
| Module-wise count rates for Quadrant A Data is divided into 100 sec bins |
 |
 |
| Module-wise count rates for Quadrant B Data is divided into 100 sec bins |
 |
 |
| Module-wise count rates for Quadrant C Data is divided into 100 sec bins |
 |
 |
| Module-wise count rates for Quadrant D Data is divided into 100 sec bins |
 |
 |
| Parameter | Plot |
|---|---|
| CZT HV Monitor |  |
| D_VDD |  |
| Temperature 1 |  |
| Veto HV Monitor |  |
| Veto LLD |  |
| Alpha Counter |  |
| _CPM_Rate |  |
| CZT Counter |  |
| +2.5 Volts monitor |  |
| +5 Volts monitor | 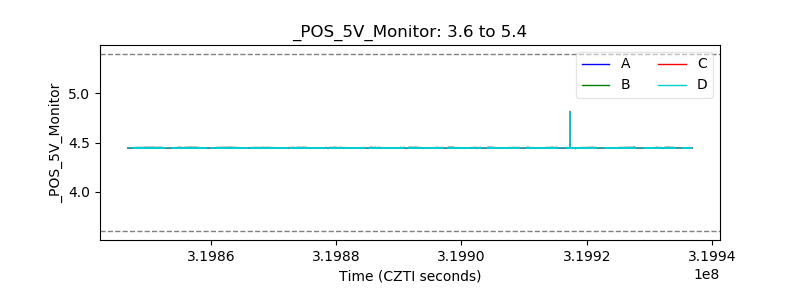 |
| _ROLL_ROT |  |
| _Roll_DEC |  |
| _Roll_RA |  |
| Veto Counter |  |