| Param | Original file | Final file |
|---|---|---|
| Filename | modeM0/AS1C05_002T06_9000003522cztM0_level2_bc.evt | modeM0/AS1C05_002T06_9000003522cztM0_level2_quad_clean.evt |
| Size (bytes) | 367,937,280 | 127,946,880 |
| Size | 350.9 MB | 122.0 MB |
| Events in quadrant A | 1,638,573 | 845,996 |
| Events in quadrant B | 1,731,489 | 883,567 |
| Events in quadrant C | 1,793,605 | 852,728 |
| Events in quadrant D | 5,471,971 | 780,771 |
| Mode M9 | |||
|---|---|---|---|
| Quadrant | BADHDUFLAG | Total packets | Discarded packets |
| A | 0 | 13 | 0 |
| B | 0 | 13 | 0 |
| C | 0 | 13 | 0 |
| D | 0 | 13 | 0 |
| Mode M0 | |||
|---|---|---|---|
| Quadrant | BADHDUFLAG | Total packets | Discarded packets |
| A | 0 | 15339 | 0 |
| B | 0 | 15696 | 0 |
| C | 0 | 15956 | 0 |
| D | 0 | 28139 | 0 |
| Mode SS | |||
|---|---|---|---|
| Quadrant | BADHDUFLAG | Total packets | Discarded packets |
| A | 0 | 150 | 0 |
| B | 0 | 150 | 0 |
| C | 0 | 150 | 0 |
| D | 0 | 150 | 0 |
| Quadrant | Total seconds | Saturated seconds | Saturation percentage |
|---|---|---|---|
| A | 7355 | 54 | 0.734194% |
| B | 7355 | 69 | 0.938137% |
| C | 7355 | 106 | 1.441196% |
| D | 7355 | 696 | 9.462950% |
Noise dominated data is calculated using 1-second bins in cleaned event files. If a bin has >2000 counts, and if more than 50% of those come from <1% of pixels, then it is considered to be noise-dominated and hence unusable.
| Quadrant | # 1 sec bins | Bins with >0 counts | Bins with >2000 counts | High rate bins dominated by noise | Noise dominated (total time) | Noise dominated (detector-on time) | Marked lightcurve |
|---|---|---|---|---|---|---|---|
| A | 8705 | 7354 | 0 | 0 | 0.00% | 0.00% |  |
| B | 8705 | 7354 | 0 | 0 | 0.00% | 0.00% |  |
| C | 8705 | 7354 | 0 | 0 | 0.00% | 0.00% |  |
| D | 8705 | 7354 | 312 | 312 | 3.58% | 4.24% |  |
Top three noisy pixels from each quadrant. If the there are fewer than three noisy pixels in the level2.evt file, extra rows are filled as -1
| Pixel properties | Quadrant properties | ||||||
|---|---|---|---|---|---|---|---|
| Quadrant | DetID | PixID | Counts | Sigma | Mean | Median | Sigma |
| A | 13 | 254 | 9604 | 100.02 | 422 | 416 | 91.9 |
| A | 8 | 255 | 9280 | 96.5 | 422 | 416 | 91.9 |
| A | 0 | 226 | 2841 | 26.4 | 422 | 416 | 91.9 |
| B | 0 | 189 | 21080 | 250.65 | 436 | 426 | 82.4 |
| B | 10 | 247 | 12732 | 149.34 | 436 | 426 | 82.4 |
| B | 10 | 249 | 10133 | 117.8 | 436 | 426 | 82.4 |
| C | 7 | 247 | 153602 | 1543.51 | 421 | 420 | 99.2 |
| C | 1 | 16 | 15238 | 149.31 | 421 | 420 | 99.2 |
| C | 0 | 10 | 6313 | 59.38 | 421 | 420 | 99.2 |
| D | 13 | 174 | 2029350 | 20954.87 | 411 | 398 | 96.8 |
| D | 1 | 52 | 900401 | 9295.17 | 411 | 398 | 96.8 |
| D | 7 | 238 | 465049 | 4798.88 | 411 | 398 | 96.8 |
Histogram calculated using DETX and DETY for each event in the final _common_clean file
| Quadrant A |  |
 |
Quadrant B |
|---|---|---|---|
| Quadrant D | 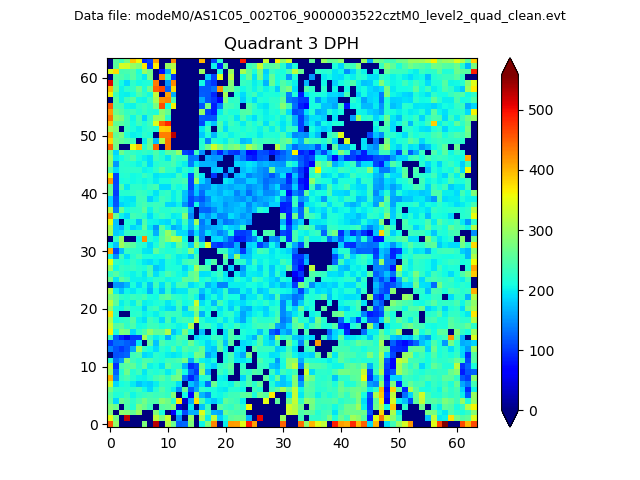 |
 |
Quadrant C |
| Plot type | Count rate plots | Images |
|---|---|---|
| Comparison with Poisson distribution Blue bars denote a histogram of data divided into 1 sec bins. Red curve is a Poisson curve with rate = median count rate of data. |
 |
 |
| Quadrant-wise count rates Data is divided into 100 sec bins |
 |
|
| Module-wise count rates for Quadrant A Data is divided into 100 sec bins |
 |
 |
| Module-wise count rates for Quadrant B Data is divided into 100 sec bins |
 |
 |
| Module-wise count rates for Quadrant C Data is divided into 100 sec bins |
 |
 |
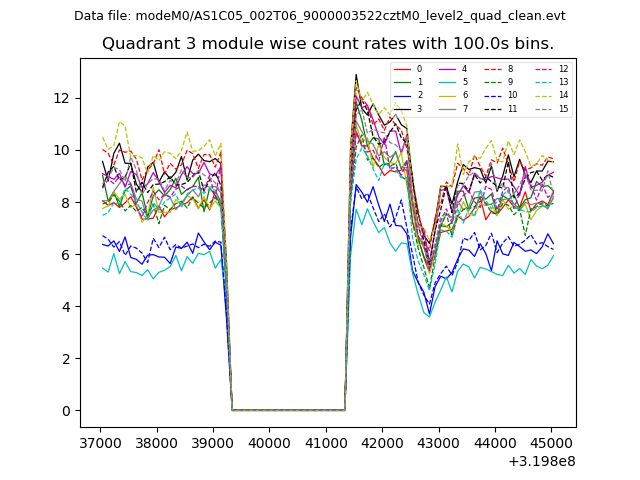
| Module-wise count rates for Quadrant D Data is divided into 100 sec bins |
 |
 |
| Parameter | Plot |
|---|---|
| CZT HV Monitor |  |
| D_VDD |  |
| Temperature 1 |  |
| Veto HV Monitor |  |
| Veto LLD |  |
| Alpha Counter | 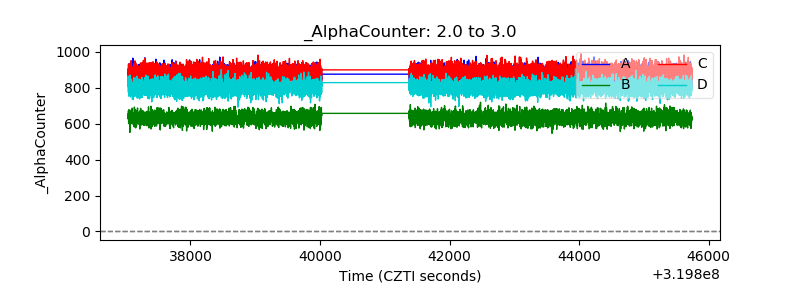 |
| _CPM_Rate |  |
| CZT Counter | 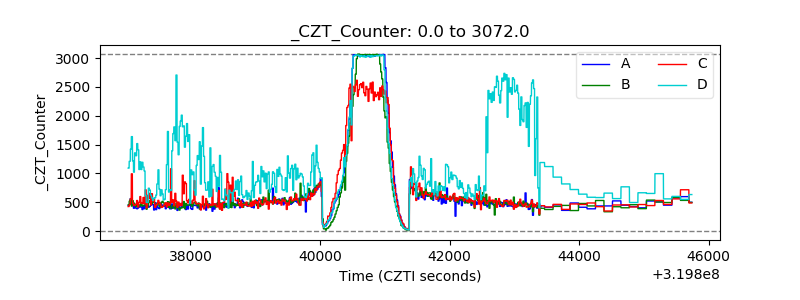 |
| +2.5 Volts monitor |  |
| +5 Volts monitor | 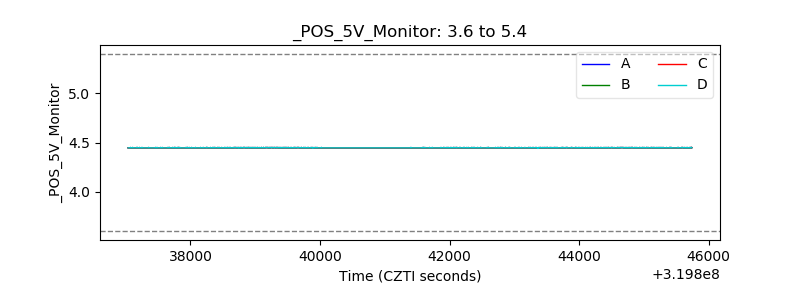 |
| _ROLL_ROT | 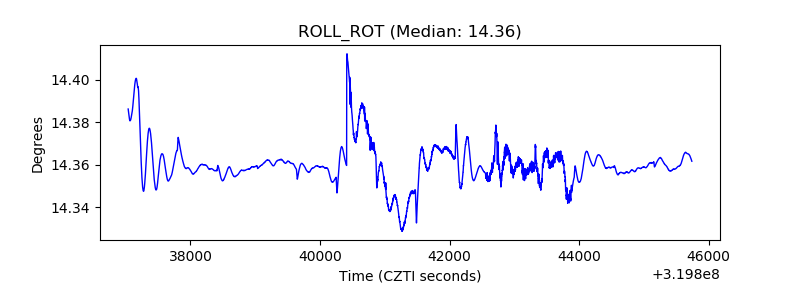 |
| _Roll_DEC | 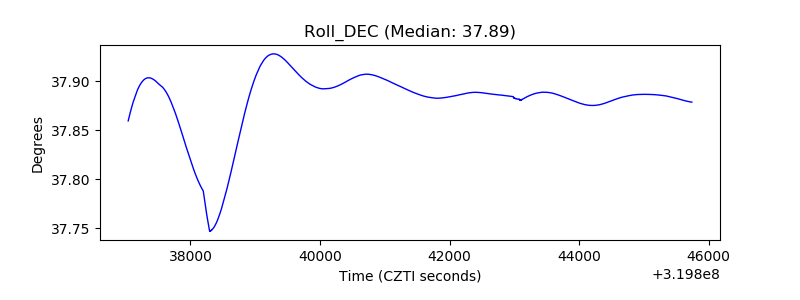 |
| _Roll_RA | 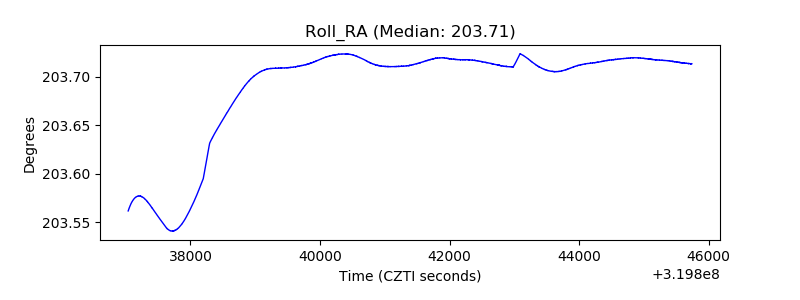 |
| Veto Counter |  |