| Param | Original file | Final file |
|---|---|---|
| Filename | modeM0/AS1A07_091T10_9000003520cztM0_level2_bc.evt | modeM0/AS1A07_091T10_9000003520cztM0_level2_quad_clean.evt |
| Size (bytes) | 618,612,480 | 209,839,680 |
| Size | 590.0 MB | 200.1 MB |
| Events in quadrant A | 3,019,945 | 1,372,123 |
| Events in quadrant B | 4,024,107 | 1,391,090 |
| Events in quadrant C | 3,286,934 | 1,366,221 |
| Events in quadrant D | 7,494,102 | 1,309,104 |
| Mode M9 | |||
|---|---|---|---|
| Quadrant | BADHDUFLAG | Total packets | Discarded packets |
| A | 0 | 36 | 0 |
| B | 0 | 36 | 0 |
| C | 0 | 36 | 0 |
| D | 0 | 36 | 0 |
| Mode M0 | |||
|---|---|---|---|
| Quadrant | BADHDUFLAG | Total packets | Discarded packets |
| A | 0 | 28713 | 0 |
| B | 0 | 32331 | 0 |
| C | 0 | 30166 | 0 |
| D | 0 | 44218 | 0 |
| Mode SS | |||
|---|---|---|---|
| Quadrant | BADHDUFLAG | Total packets | Discarded packets |
| A | 0 | 272 | 0 |
| B | 0 | 272 | 0 |
| C | 0 | 272 | 0 |
| D | 0 | 272 | 0 |
| Quadrant | Total seconds | Saturated seconds | Saturation percentage |
|---|---|---|---|
| A | 13278 | 135 | 1.016719% |
| B | 13278 | 423 | 3.185721% |
| C | 13278 | 299 | 2.251845% |
| D | 13278 | 689 | 5.189034% |
Noise dominated data is calculated using 1-second bins in cleaned event files. If a bin has >2000 counts, and if more than 50% of those come from <1% of pixels, then it is considered to be noise-dominated and hence unusable.
| Quadrant | # 1 sec bins | Bins with >0 counts | Bins with >2000 counts | High rate bins dominated by noise | Noise dominated (total time) | Noise dominated (detector-on time) | Marked lightcurve |
|---|---|---|---|---|---|---|---|
| A | 16908 | 13275 | 0 | 0 | 0.00% | 0.00% |  |
| B | 16908 | 13275 | 96 | 96 | 0.57% | 0.72% |  |
| C | 16908 | 13275 | 6 | 6 | 0.04% | 0.05% |  |
| D | 16908 | 13275 | 71 | 71 | 0.42% | 0.53% |  |
Top three noisy pixels from each quadrant. If the there are fewer than three noisy pixels in the level2.evt file, extra rows are filled as -1
| Pixel properties | Quadrant properties | ||||||
|---|---|---|---|---|---|---|---|
| Quadrant | DetID | PixID | Counts | Sigma | Mean | Median | Sigma |
| A | 13 | 254 | 20734 | 119.35 | 781 | 768 | 167.3 |
| A | 0 | 226 | 5137 | 26.12 | 781 | 768 | 167.3 |
| A | 12 | 194 | 4860 | 24.46 | 781 | 768 | 167.3 |
| B | 3 | 64 | 601719 | 4065.57 | 792 | 774 | 147.8 |
| B | 10 | 247 | 242531 | 1635.56 | 792 | 774 | 147.8 |
| B | 0 | 229 | 77282 | 517.6 | 792 | 774 | 147.8 |
| C | 7 | 247 | 290519 | 1613.27 | 771 | 772 | 179.6 |
| C | 0 | 10 | 25011 | 134.96 | 771 | 772 | 179.6 |
| C | 10 | 91 | 7518 | 37.56 | 771 | 772 | 179.6 |
| D | 1 | 52 | 2114495 | 12299.87 | 760 | 736 | 171.9 |
| D | 8 | 195 | 1090603 | 6341.89 | 760 | 736 | 171.9 |
| D | 7 | 238 | 839696 | 4881.87 | 760 | 736 | 171.9 |
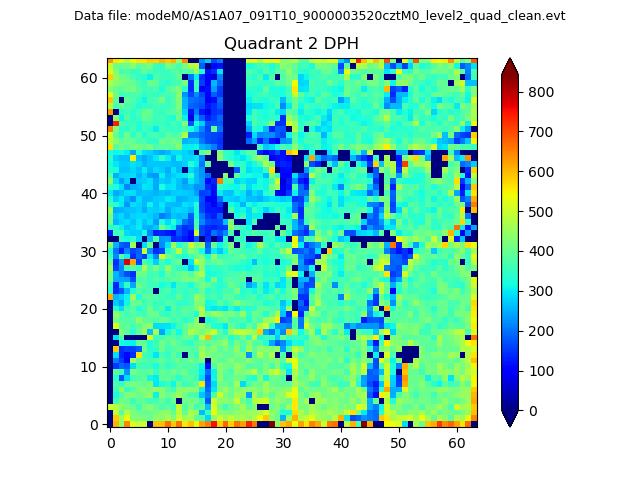
Histogram calculated using DETX and DETY for each event in the final _common_clean file
| Quadrant A | 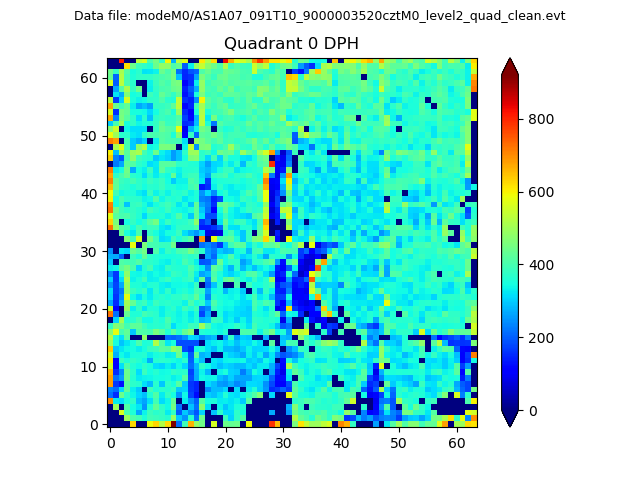 |
 |
Quadrant B |
|---|---|---|---|
| Quadrant D | 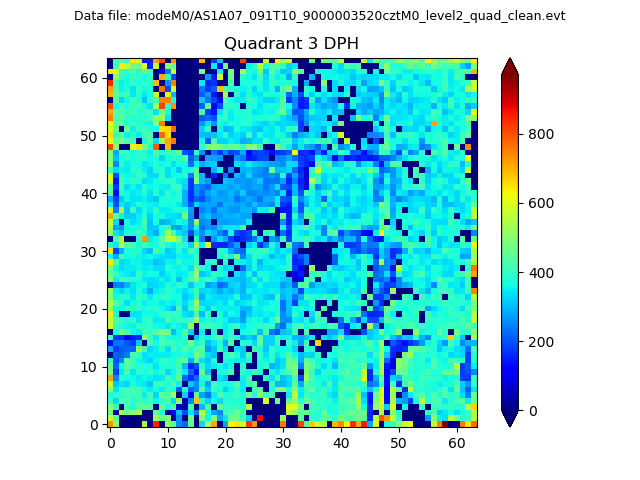 |
 |
Quadrant C |
| Plot type | Count rate plots | Images |
|---|---|---|
| Comparison with Poisson distribution Blue bars denote a histogram of data divided into 1 sec bins. Red curve is a Poisson curve with rate = median count rate of data. |
 |
 |
| Quadrant-wise count rates Data is divided into 100 sec bins |
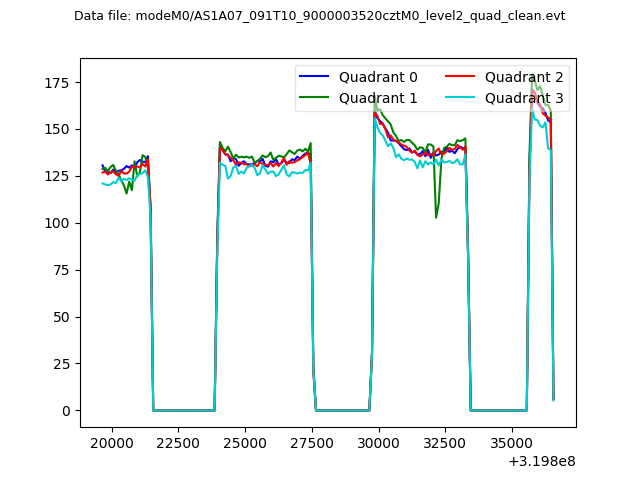 |
|
| Module-wise count rates for Quadrant A Data is divided into 100 sec bins |
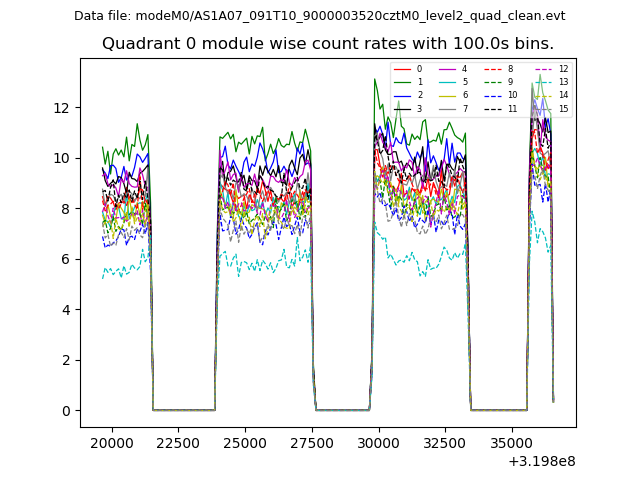 |
 |
| Module-wise count rates for Quadrant B Data is divided into 100 sec bins |
 |
 |
| Module-wise count rates for Quadrant C Data is divided into 100 sec bins |
 |
 |
| Module-wise count rates for Quadrant D Data is divided into 100 sec bins |
 |
 |
| Parameter | Plot |
|---|---|
| CZT HV Monitor |  |
| D_VDD |  |
| Temperature 1 |  |
| Veto HV Monitor | 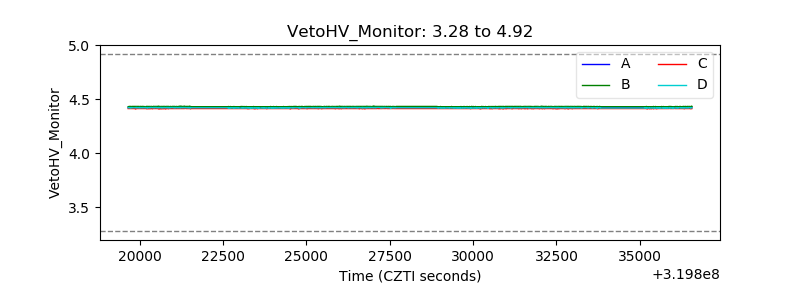 |
| Veto LLD |  |
| Alpha Counter |  |
| _CPM_Rate | 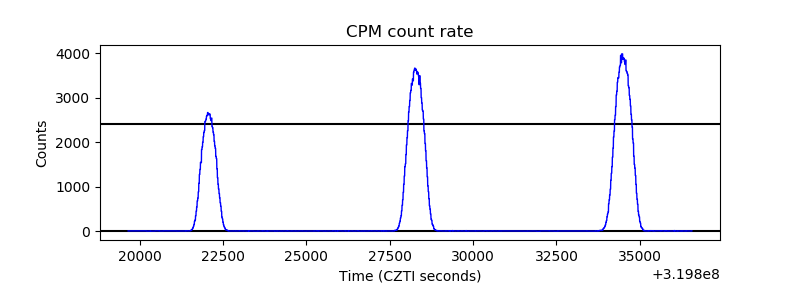 |
| CZT Counter |  |
| +2.5 Volts monitor |  |
| +5 Volts monitor |  |
| _ROLL_ROT |  |
| _Roll_DEC |  |
| _Roll_RA |  |
| Veto Counter |  |