| Param | Original file | Final file |
|---|---|---|
| Filename | modeM0/AS1C05_007T01_9000003518cztM0_level2_bc.evt | modeM0/AS1C05_007T01_9000003518cztM0_level2_quad_clean.evt |
| Size (bytes) | 2,023,634,880 | 601,637,760 |
| Size | 1.9 GB | 573.8 MB |
| Events in quadrant A | 10,146,448 | 3,719,320 |
| Events in quadrant B | 13,075,149 | 3,770,389 |
| Events in quadrant C | 11,168,929 | 3,678,361 |
| Events in quadrant D | 23,411,511 | 3,546,347 |
| Mode M9 | |||
|---|---|---|---|
| Quadrant | BADHDUFLAG | Total packets | Discarded packets |
| A | 0 | 57 | 0 |
| B | 0 | 57 | 0 |
| C | 0 | 57 | 0 |
| D | 0 | 57 | 0 |
| Mode SS | |||
|---|---|---|---|
| Quadrant | BADHDUFLAG | Total packets | Discarded packets |
| A | 0 | 1042 | 0 |
| B | 0 | 1042 | 0 |
| C | 0 | 1042 | 0 |
| D | 0 | 1042 | 0 |
| Mode M0 | |||
|---|---|---|---|
| Quadrant | BADHDUFLAG | Total packets | Discarded packets |
| A | 0 | 105221 | 0 |
| B | 0 | 116144 | 0 |
| C | 0 | 108818 | 0 |
| D | 0 | 145581 | 0 |
| Quadrant | Total seconds | Saturated seconds | Saturation percentage |
|---|---|---|---|
| A | 51112 | 705 | 1.379324% |
| B | 51112 | 1735 | 3.394506% |
| C | 51112 | 1190 | 2.328220% |
| D | 51112 | 2043 | 3.997104% |
Noise dominated data is calculated using 1-second bins in cleaned event files. If a bin has >2000 counts, and if more than 50% of those come from <1% of pixels, then it is considered to be noise-dominated and hence unusable.
| Quadrant | # 1 sec bins | Bins with >0 counts | Bins with >2000 counts | High rate bins dominated by noise | Noise dominated (total time) | Noise dominated (detector-on time) | Marked lightcurve |
|---|---|---|---|---|---|---|---|
| A | 56897 | 51109 | 0 | 0 | 0.00% | 0.00% |  |
| B | 56897 | 51104 | 39 | 39 | 0.07% | 0.08% |  |
| C | 56897 | 51105 | 52 | 52 | 0.09% | 0.10% |  |
| D | 56897 | 51107 | 572 | 572 | 1.01% | 1.12% |  |
Top three noisy pixels from each quadrant. If the there are fewer than three noisy pixels in the level2.evt file, extra rows are filled as -1
| Pixel properties | Quadrant properties | ||||||
|---|---|---|---|---|---|---|---|
| Quadrant | DetID | PixID | Counts | Sigma | Mean | Median | Sigma |
| A | 13 | 254 | 85231 | 144.8 | 2620 | 2566 | 570.9 |
| A | 0 | 226 | 16823 | 24.97 | 2620 | 2566 | 570.9 |
| A | 12 | 194 | 16188 | 23.86 | 2620 | 2566 | 570.9 |
| B | 3 | 64 | 2081374 | 4180.86 | 2640 | 2569 | 497.2 |
| B | 0 | 189 | 229161 | 455.72 | 2640 | 2569 | 497.2 |
| B | 0 | 229 | 198995 | 395.05 | 2640 | 2569 | 497.2 |
| C | 10 | 9 | 681281 | 1120.78 | 2580 | 2564 | 605.6 |
| C | 7 | 247 | 259481 | 424.25 | 2580 | 2564 | 605.6 |
| C | 10 | 91 | 207226 | 337.96 | 2580 | 2564 | 605.6 |
| D | 1 | 52 | 7584275 | 12496.49 | 2594 | 2503 | 606.7 |
| D | 8 | 195 | 4767102 | 7853.14 | 2594 | 2503 | 606.7 |
| D | 12 | 233 | 357907 | 585.79 | 2594 | 2503 | 606.7 |
Histogram calculated using DETX and DETY for each event in the final _common_clean file
| Quadrant A |  |
 |
Quadrant B |
|---|---|---|---|
| Quadrant D |  |
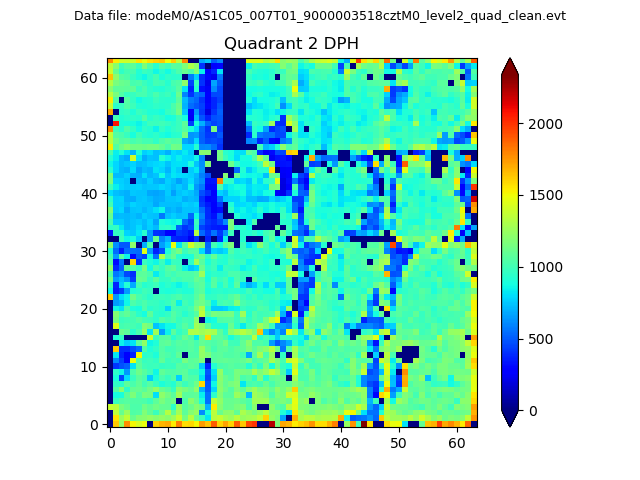 |
Quadrant C |
| Plot type | Count rate plots | Images |
|---|---|---|
| Comparison with Poisson distribution Blue bars denote a histogram of data divided into 1 sec bins. Red curve is a Poisson curve with rate = median count rate of data. |
 |
 |
| Quadrant-wise count rates Data is divided into 100 sec bins |
 |
|
| Module-wise count rates for Quadrant A Data is divided into 100 sec bins |
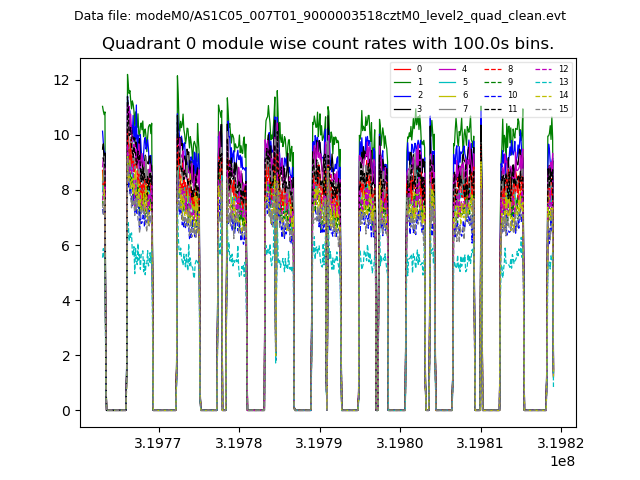 |
 |
| Module-wise count rates for Quadrant B Data is divided into 100 sec bins |
 |
 |
| Module-wise count rates for Quadrant C Data is divided into 100 sec bins |
 |
 |
| Module-wise count rates for Quadrant D Data is divided into 100 sec bins |
 |
 |
| Parameter | Plot |
|---|---|
| CZT HV Monitor |  |
| D_VDD |  |
| Temperature 1 | 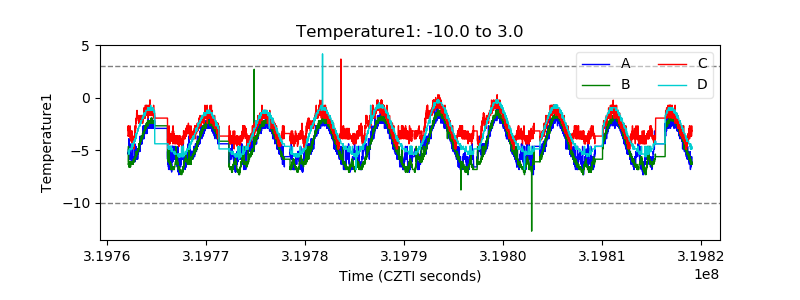 |
| Veto HV Monitor |  |
| Veto LLD |  |
| Alpha Counter |  |
| _CPM_Rate |  |
| CZT Counter |  |
| +2.5 Volts monitor |  |
| +5 Volts monitor |  |
| _ROLL_ROT |  |
| _Roll_DEC |  |
| _Roll_RA |  |
| Veto Counter |  |