| Param | Original file | Final file |
|---|---|---|
| Filename | modeM0/AS1A08_009T01_9000003516cztM0_level2_bc.evt | modeM0/AS1A08_009T01_9000003516cztM0_level2_quad_clean.evt |
| Size (bytes) | 2,796,736,320 | 1,106,760,960 |
| Size | 2.6 GB | 1.0 GB |
| Events in quadrant A | 15,269,120 | 7,187,363 |
| Events in quadrant B | 18,923,122 | 7,331,877 |
| Events in quadrant C | 16,265,453 | 7,110,432 |
| Events in quadrant D | 29,168,278 | 6,787,467 |
| Mode M9 | |||
|---|---|---|---|
| Quadrant | BADHDUFLAG | Total packets | Discarded packets |
| A | 0 | 123 | 0 |
| B | 0 | 123 | 0 |
| C | 0 | 123 | 0 |
| D | 0 | 123 | 0 |
| Mode SS | |||
|---|---|---|---|
| Quadrant | BADHDUFLAG | Total packets | Discarded packets |
| A | 0 | 1522 | 0 |
| B | 0 | 1522 | 0 |
| C | 0 | 1522 | 0 |
| D | 0 | 1522 | 0 |
| Mode M0 | |||
|---|---|---|---|
| Quadrant | BADHDUFLAG | Total packets | Discarded packets |
| A | 0 | 153790 | 0 |
| B | 0 | 165765 | 0 |
| C | 0 | 157533 | 0 |
| D | 0 | 195130 | 0 |
| Quadrant | Total seconds | Saturated seconds | Saturation percentage |
|---|---|---|---|
| A | 74485 | 701 | 0.941129% |
| B | 74485 | 1520 | 2.040679% |
| C | 74485 | 1178 | 1.581526% |
| D | 74485 | 2020 | 2.711955% |
Noise dominated data is calculated using 1-second bins in cleaned event files. If a bin has >2000 counts, and if more than 50% of those come from <1% of pixels, then it is considered to be noise-dominated and hence unusable.
| Quadrant | # 1 sec bins | Bins with >0 counts | Bins with >2000 counts | High rate bins dominated by noise | Noise dominated (total time) | Noise dominated (detector-on time) | Marked lightcurve |
|---|---|---|---|---|---|---|---|
| A | 86820 | 74480 | 0 | 0 | 0.00% | 0.00% |  |
| B | 86820 | 74478 | 29 | 29 | 0.03% | 0.04% | 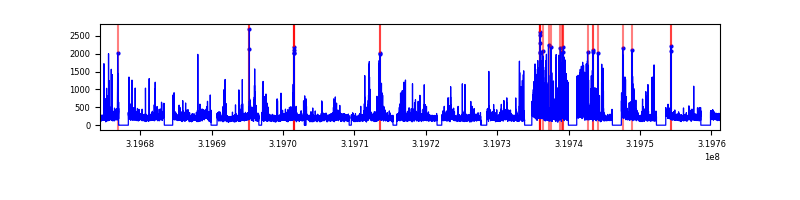 |
| C | 86820 | 74479 | 5 | 5 | 0.01% | 0.01% |  |
| D | 86820 | 74478 | 261 | 261 | 0.30% | 0.35% | 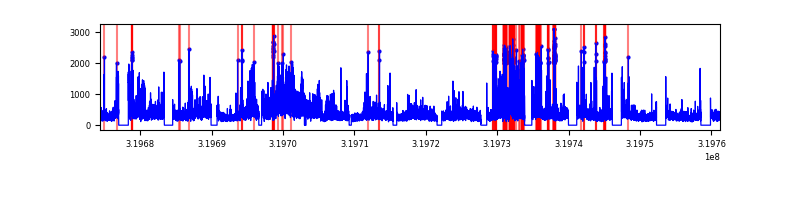 |
Top three noisy pixels from each quadrant. If the there are fewer than three noisy pixels in the level2.evt file, extra rows are filled as -1
| Pixel properties | Quadrant properties | ||||||
|---|---|---|---|---|---|---|---|
| Quadrant | DetID | PixID | Counts | Sigma | Mean | Median | Sigma |
| A | 13 | 254 | 123093 | 138.61 | 3953 | 3882 | 860.0 |
| A | 0 | 226 | 25287 | 24.89 | 3953 | 3882 | 860.0 |
| A | 12 | 194 | 24433 | 23.9 | 3953 | 3882 | 860.0 |
| B | 3 | 64 | 1928349 | 2531.92 | 4015 | 3917 | 760.1 |
| B | 0 | 229 | 739019 | 967.15 | 4015 | 3917 | 760.1 |
| B | 0 | 189 | 459971 | 600.02 | 4015 | 3917 | 760.1 |
| C | 7 | 247 | 740666 | 802.48 | 3865 | 3846 | 918.2 |
| C | 10 | 9 | 528299 | 571.19 | 3865 | 3846 | 918.2 |
| C | 10 | 91 | 64463 | 66.02 | 3865 | 3846 | 918.2 |
| D | 8 | 195 | 10530750 | 11668.27 | 3863 | 3732 | 902.2 |
| D | 1 | 52 | 2881111 | 3189.32 | 3863 | 3732 | 902.2 |
| D | 13 | 174 | 432862 | 475.65 | 3863 | 3732 | 902.2 |
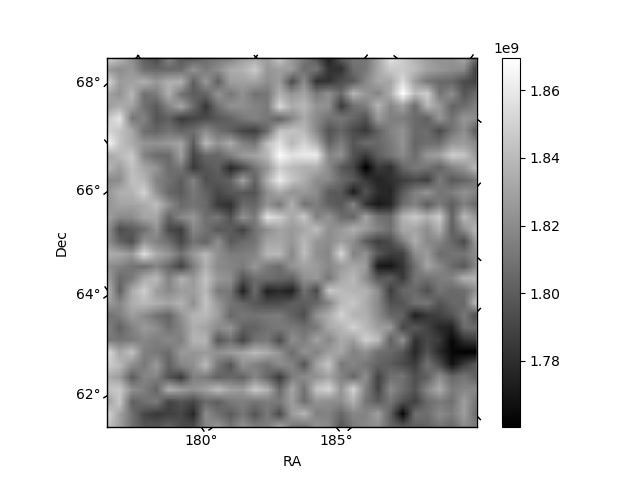
Histogram calculated using DETX and DETY for each event in the final _common_clean file
| Quadrant A |  |
 |
Quadrant B |
|---|---|---|---|
| Quadrant D |  |
 |
Quadrant C |
| Plot type | Count rate plots | Images |
|---|---|---|
| Comparison with Poisson distribution Blue bars denote a histogram of data divided into 1 sec bins. Red curve is a Poisson curve with rate = median count rate of data. |
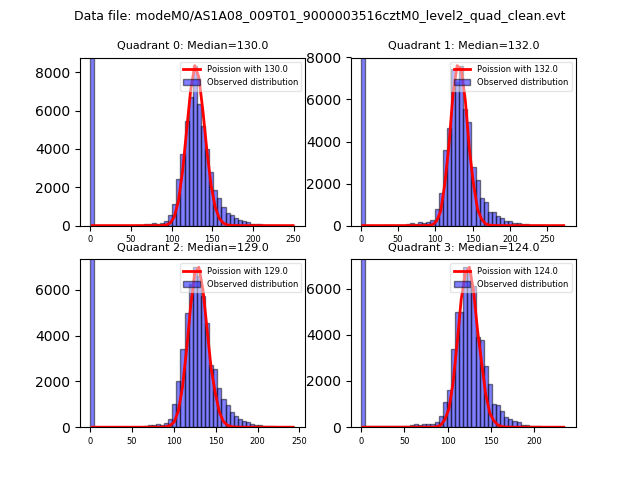 |
 |
| Quadrant-wise count rates Data is divided into 100 sec bins |
 |
|
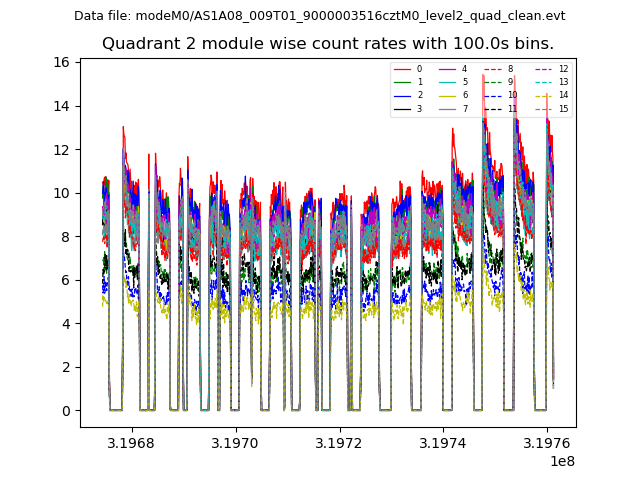
| Module-wise count rates for Quadrant A Data is divided into 100 sec bins |
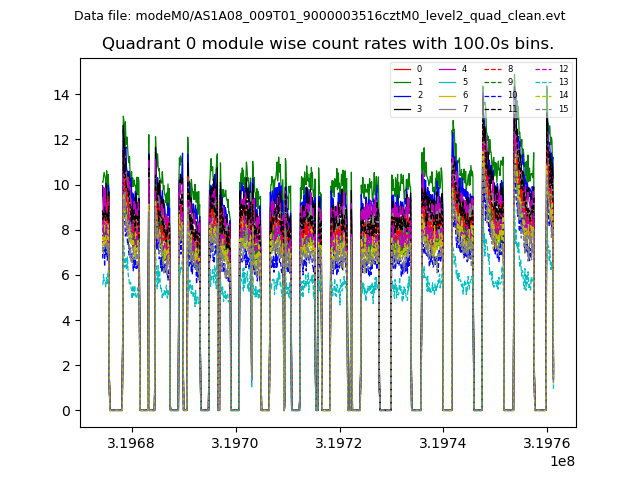 |
 |
| Module-wise count rates for Quadrant B Data is divided into 100 sec bins |
 |
 |
| Module-wise count rates for Quadrant C Data is divided into 100 sec bins |
 |
 |
| Module-wise count rates for Quadrant D Data is divided into 100 sec bins |
 |
 |
| Parameter | Plot |
|---|---|
| CZT HV Monitor |  |
| D_VDD |  |
| Temperature 1 | 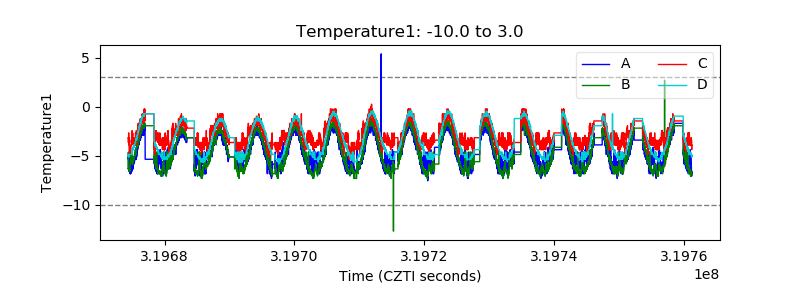 |
| Veto HV Monitor |  |
| Veto LLD | 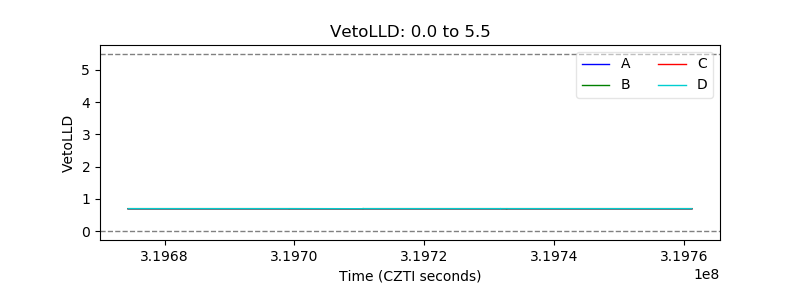 |
| Alpha Counter |  |
| _CPM_Rate |  |
| CZT Counter |  |
| +2.5 Volts monitor |  |
| +5 Volts monitor |  |
| _ROLL_ROT |  |
| _Roll_DEC | 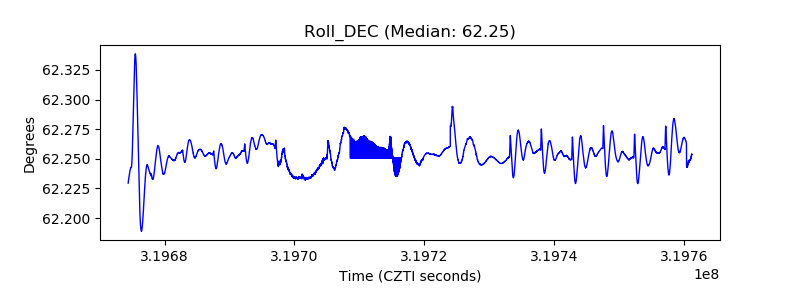 |
| _Roll_RA |  |
| Veto Counter |  |