| Param | Original file | Final file |
|---|---|---|
| Filename | modeM0/AS1A07_027T14_9000003510cztM0_level2_bc.evt | modeM0/AS1A07_027T14_9000003510cztM0_level2_quad_clean.evt |
| Size (bytes) | 719,023,680 | 167,604,480 |
| Size | 685.7 MB | 159.8 MB |
| Events in quadrant A | 2,901,200 | 1,029,615 |
| Events in quadrant B | 4,090,810 | 1,041,860 |
| Events in quadrant C | 2,909,538 | 1,013,905 |
| Events in quadrant D | 10,849,488 | 957,742 |
| Mode M0 | |||
|---|---|---|---|
| Quadrant | BADHDUFLAG | Total packets | Discarded packets |
| A | 0 | 30539 | 0 |
| B | 0 | 35014 | 0 |
| C | 0 | 30668 | 0 |
| D | 0 | 57403 | 0 |
| Mode SS | |||
|---|---|---|---|
| Quadrant | BADHDUFLAG | Total packets | Discarded packets |
| A | 0 | 304 | 0 |
| B | 0 | 304 | 0 |
| C | 0 | 304 | 0 |
| D | 0 | 304 | 0 |
| Mode M9 | |||
|---|---|---|---|
| Quadrant | BADHDUFLAG | Total packets | Discarded packets |
| A | 0 | 6 | 0 |
| B | 0 | 6 | 0 |
| C | 0 | 6 | 0 |
| D | 0 | 6 | 0 |
| Quadrant | Total seconds | Saturated seconds | Saturation percentage |
|---|---|---|---|
| A | 14955 | 270 | 1.805416% |
| B | 14955 | 495 | 3.309930% |
| C | 14955 | 311 | 2.079572% |
| D | 14955 | 2266 | 15.152123% |
Noise dominated data is calculated using 1-second bins in cleaned event files. If a bin has >2000 counts, and if more than 50% of those come from <1% of pixels, then it is considered to be noise-dominated and hence unusable.
| Quadrant | # 1 sec bins | Bins with >0 counts | Bins with >2000 counts | High rate bins dominated by noise | Noise dominated (total time) | Noise dominated (detector-on time) | Marked lightcurve |
|---|---|---|---|---|---|---|---|
| A | 15565 | 14954 | 0 | 0 | 0.00% | 0.00% |  |
| B | 15565 | 14953 | 20 | 20 | 0.13% | 0.13% |  |
| C | 15565 | 14954 | 2 | 2 | 0.01% | 0.01% |  |
| D | 15565 | 14954 | 531 | 531 | 3.41% | 3.55% |  |
Top three noisy pixels from each quadrant. If the there are fewer than three noisy pixels in the level2.evt file, extra rows are filled as -1
| Pixel properties | Quadrant properties | ||||||
|---|---|---|---|---|---|---|---|
| Quadrant | DetID | PixID | Counts | Sigma | Mean | Median | Sigma |
| A | 13 | 254 | 24335 | 142.29 | 745 | 729 | 165.9 |
| A | 5 | 168 | 11874 | 67.18 | 745 | 729 | 165.9 |
| A | 2 | 79 | 7176 | 38.86 | 745 | 729 | 165.9 |
| B | 0 | 229 | 383029 | 2641.5 | 748 | 729 | 144.7 |
| B | 0 | 189 | 344130 | 2372.72 | 748 | 729 | 144.7 |
| B | 3 | 64 | 307368 | 2118.72 | 748 | 729 | 144.7 |
| C | 7 | 247 | 60830 | 349.32 | 723 | 717 | 172.1 |
| C | 10 | 9 | 26042 | 147.17 | 723 | 717 | 172.1 |
| C | 4 | 175 | 17012 | 94.69 | 723 | 717 | 172.1 |
| D | 8 | 195 | 5373384 | 31522.58 | 706 | 677 | 170.4 |
| D | 1 | 52 | 1383048 | 8110.6 | 706 | 677 | 170.4 |
| D | 12 | 227 | 609637 | 3572.87 | 706 | 677 | 170.4 |
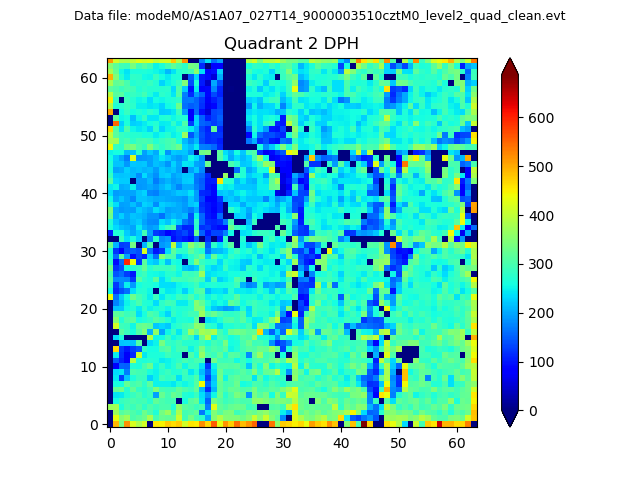
Histogram calculated using DETX and DETY for each event in the final _common_clean file
| Quadrant A |  |
 |
Quadrant B |
|---|---|---|---|
| Quadrant D |  |
 |
Quadrant C |
| Plot type | Count rate plots | Images |
|---|---|---|
| Comparison with Poisson distribution Blue bars denote a histogram of data divided into 1 sec bins. Red curve is a Poisson curve with rate = median count rate of data. |
 |
 |
| Quadrant-wise count rates Data is divided into 100 sec bins |
 |
|
| Module-wise count rates for Quadrant A Data is divided into 100 sec bins |
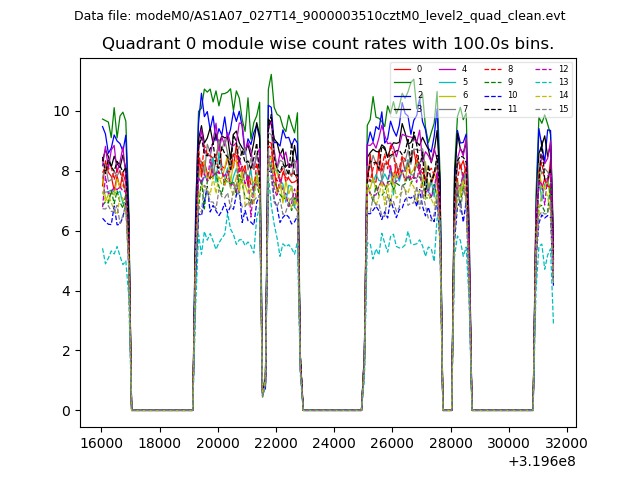 |
 |
| Module-wise count rates for Quadrant B Data is divided into 100 sec bins |
 |
 |
| Module-wise count rates for Quadrant C Data is divided into 100 sec bins |
 |
 |
| Module-wise count rates for Quadrant D Data is divided into 100 sec bins |
 |
 |
| Parameter | Plot |
|---|---|
| CZT HV Monitor |  |
| D_VDD |  |
| Temperature 1 |  |
| Veto HV Monitor |  |
| Veto LLD |  |
| Alpha Counter |  |
| _CPM_Rate |  |
| CZT Counter | 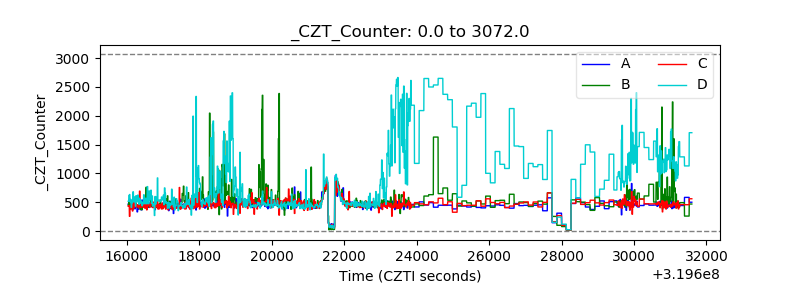 |
| +2.5 Volts monitor |  |
| +5 Volts monitor |  |
| _ROLL_ROT |  |
| _Roll_DEC |  |
| _Roll_RA |  |
| Veto Counter |  |