| Param | Original file | Final file |
|---|---|---|
| Filename | modeM0/AS1A07_027T09_9000003512cztM0_level2.evt | modeM0/AS1A07_027T09_9000003512cztM0_level2_quad_clean.evt |
| Size (bytes) | 1,239,831,360 | 195,048,000 |
| Size | 1.2 GB | 186.0 MB |
| Events in quadrant A | 6,711,602 | 1,260,593 |
| Events in quadrant B | 8,571,870 | 1,248,991 |
| Events in quadrant C | 6,851,773 | 1,238,418 |
| Events in quadrant D | 14,444,680 | 1,167,208 |
| Mode M9 | |||
|---|---|---|---|
| Quadrant | BADHDUFLAG | Total packets | Discarded packets |
| A | 0 | 23 | 0 |
| B | 0 | 23 | 0 |
| C | 0 | 23 | 0 |
| D | 0 | 23 | 0 |
| Mode M0 | |||
|---|---|---|---|
| Quadrant | BADHDUFLAG | Total packets | Discarded packets |
| A | 0 | 29502 | 0 |
| B | 0 | 34731 | 0 |
| C | 0 | 29739 | 0 |
| D | 0 | 53359 | 0 |
| Mode SS | |||
|---|---|---|---|
| Quadrant | BADHDUFLAG | Total packets | Discarded packets |
| A | 0 | 296 | 0 |
| B | 0 | 296 | 0 |
| C | 0 | 296 | 0 |
| D | 0 | 296 | 0 |
| Quadrant | Total seconds | Saturated seconds | Saturation percentage |
|---|---|---|---|
| A | 14363 | 151 | 1.051312% |
| B | 14363 | 468 | 3.258372% |
| C | 14363 | 208 | 1.448165% |
| D | 14363 | 563 | 3.919794% |
Noise dominated data is calculated using 1-second bins in cleaned event files. If a bin has >2000 counts, and if more than 50% of those come from <1% of pixels, then it is considered to be noise-dominated and hence unusable.
| Quadrant | # 1 sec bins | Bins with >0 counts | Bins with >2000 counts | High rate bins dominated by noise | Noise dominated (total time) | Noise dominated (detector-on time) | Marked lightcurve |
|---|---|---|---|---|---|---|---|
| A | 16713 | 14363 | 2 | 2 | 0.01% | 0.01% |  |
| B | 16713 | 14363 | 285 | 285 | 1.71% | 1.98% |  |
| C | 16713 | 14363 | 1 | 1 | 0.01% | 0.01% |  |
| D | 16713 | 14363 | 479 | 479 | 2.87% | 3.33% |  |
Top three noisy pixels from each quadrant. If the there are fewer than three noisy pixels in the level2.evt file, extra rows are filled as -1
| Pixel properties | Quadrant properties | ||||||
|---|---|---|---|---|---|---|---|
| Quadrant | DetID | PixID | Counts | Sigma | Mean | Median | Sigma |
| A | 13 | 254 | 25541 | 68.09 | 1736 | 1697 | 350.2 |
| A | 3 | 137 | 15463 | 39.31 | 1736 | 1697 | 350.2 |
| A | 0 | 226 | 14970 | 37.9 | 1736 | 1697 | 350.2 |
| B | 3 | 64 | 993025 | 3038.04 | 1711 | 1671 | 326.3 |
| B | 0 | 229 | 478106 | 1460.05 | 1711 | 1671 | 326.3 |
| B | 0 | 189 | 289475 | 881.98 | 1711 | 1671 | 326.3 |
| C | 14 | 238 | 265424 | 676.1 | 1660 | 1667 | 390.1 |
| C | 7 | 247 | 102128 | 257.52 | 1660 | 1667 | 390.1 |
| C | 2 | 16 | 16802 | 38.8 | 1660 | 1667 | 390.1 |
| D | 8 | 195 | 6299960 | 15615.12 | 1661 | 1611 | 403.3 |
| D | 1 | 52 | 895367 | 2215.84 | 1661 | 1611 | 403.3 |
| D | 7 | 238 | 292378 | 720.88 | 1661 | 1611 | 403.3 |
Histogram calculated using DETX and DETY for each event in the final _common_clean file
| Quadrant A | 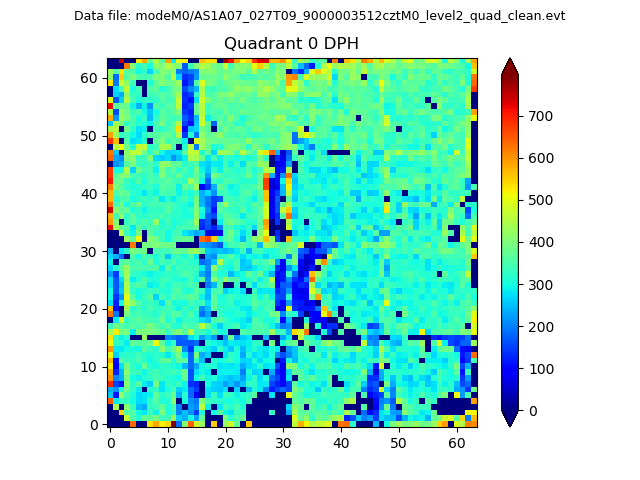 |
 |
Quadrant B |
|---|---|---|---|
| Quadrant D |  |
 |
Quadrant C |
| Plot type | Count rate plots | Images |
|---|---|---|
| Comparison with Poisson distribution Blue bars denote a histogram of data divided into 1 sec bins. Red curve is a Poisson curve with rate = median count rate of data. |
 |
 |
| Quadrant-wise count rates Data is divided into 100 sec bins |
 |
|
| Module-wise count rates for Quadrant A Data is divided into 100 sec bins |
 |
 |
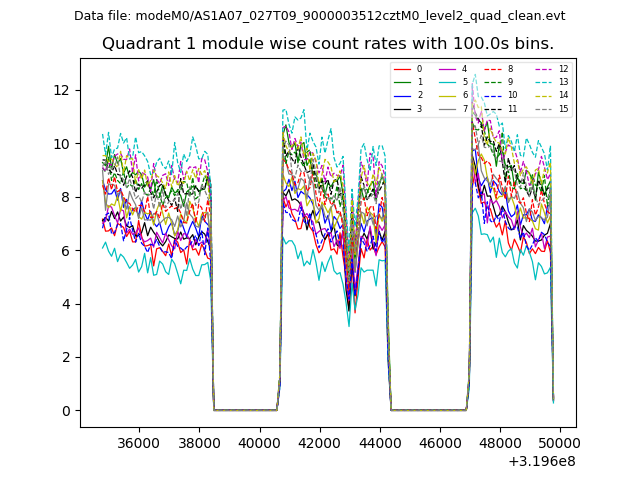
| Module-wise count rates for Quadrant B Data is divided into 100 sec bins |
 |
 |
| Module-wise count rates for Quadrant C Data is divided into 100 sec bins |
 |
 |
| Module-wise count rates for Quadrant D Data is divided into 100 sec bins |
 |
 |
| Parameter | Plot |
|---|---|
| CZT HV Monitor |  |
| D_VDD |  |
| Temperature 1 |  |
| Veto HV Monitor |  |
| Veto LLD | 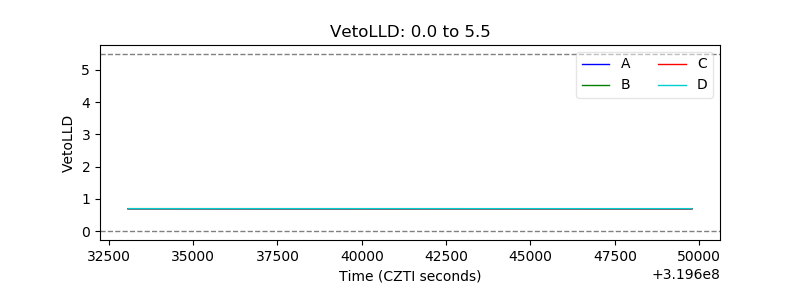 |
| Alpha Counter |  |
| _CPM_Rate | 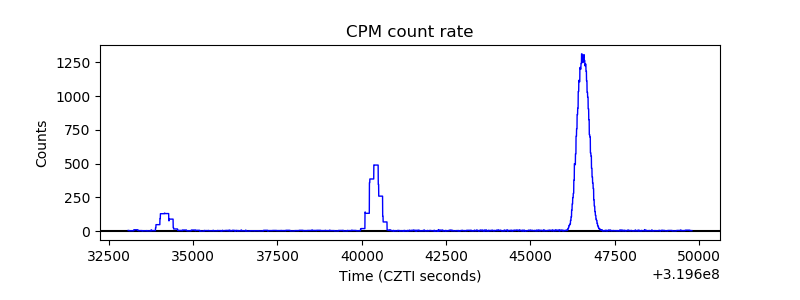 |
| CZT Counter |  |
| +2.5 Volts monitor |  |
| +5 Volts monitor |  |
| _ROLL_ROT |  |
| _Roll_DEC |  |
| _Roll_RA | 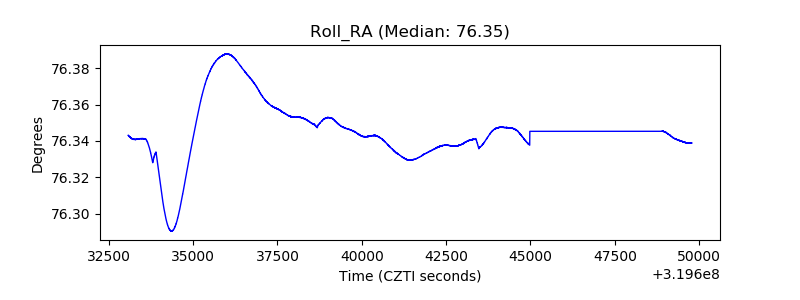 |
| Veto Counter |  |