| Param | Original file | Final file |
|---|---|---|
| Filename | modeM0/AS1A07_027T05_9000003506cztM0_level2_bc.evt | modeM0/AS1A07_027T05_9000003506cztM0_level2_quad_clean.evt |
| Size (bytes) | 944,046,720 | 297,918,720 |
| Size | 900.3 MB | 284.1 MB |
| Events in quadrant A | 4,867,864 | 1,890,317 |
| Events in quadrant B | 6,631,618 | 1,886,369 |
| Events in quadrant C | 4,878,037 | 1,848,201 |
| Events in quadrant D | 10,533,408 | 1,707,987 |
| Mode M0 | |||
|---|---|---|---|
| Quadrant | BADHDUFLAG | Total packets | Discarded packets |
| A | 0 | 50537 | 0 |
| B | 0 | 56409 | 0 |
| C | 0 | 51080 | 0 |
| D | 0 | 70675 | 0 |
| Mode M9 | |||
|---|---|---|---|
| Quadrant | BADHDUFLAG | Total packets | Discarded packets |
| A | 0 | 33 | 0 |
| B | 0 | 33 | 0 |
| C | 0 | 33 | 0 |
| D | 0 | 33 | 0 |
| Mode SS | |||
|---|---|---|---|
| Quadrant | BADHDUFLAG | Total packets | Discarded packets |
| A | 0 | 504 | 0 |
| B | 0 | 504 | 0 |
| C | 0 | 504 | 0 |
| D | 0 | 504 | 0 |
| Quadrant | Total seconds | Saturated seconds | Saturation percentage |
|---|---|---|---|
| A | 24555 | 285 | 1.160660% |
| B | 24555 | 610 | 2.484219% |
| C | 24555 | 451 | 1.836693% |
| D | 24555 | 1891 | 7.701079% |
Noise dominated data is calculated using 1-second bins in cleaned event files. If a bin has >2000 counts, and if more than 50% of those come from <1% of pixels, then it is considered to be noise-dominated and hence unusable.
| Quadrant | # 1 sec bins | Bins with >0 counts | Bins with >2000 counts | High rate bins dominated by noise | Noise dominated (total time) | Noise dominated (detector-on time) | Marked lightcurve |
|---|---|---|---|---|---|---|---|
| A | 27955 | 24551 | 0 | 0 | 0.00% | 0.00% | 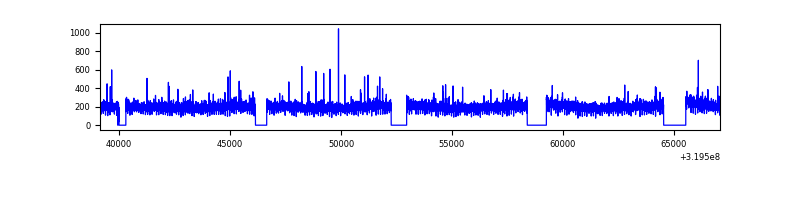 |
| B | 27955 | 24549 | 31 | 31 | 0.11% | 0.13% | 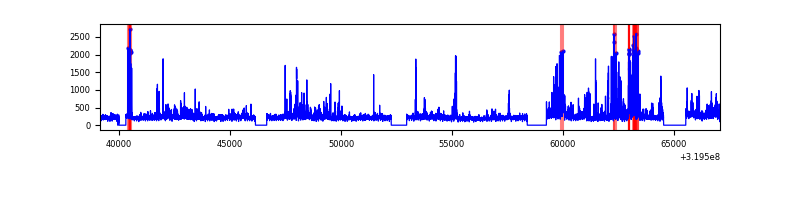 |
| C | 27955 | 24551 | 1 | 1 | 0.00% | 0.00% |  |
| D | 27955 | 24548 | 472 | 472 | 1.69% | 1.92% |  |
Top three noisy pixels from each quadrant. If the there are fewer than three noisy pixels in the level2.evt file, extra rows are filled as -1
| Pixel properties | Quadrant properties | ||||||
|---|---|---|---|---|---|---|---|
| Quadrant | DetID | PixID | Counts | Sigma | Mean | Median | Sigma |
| A | 13 | 254 | 42188 | 147.45 | 1256 | 1228 | 277.8 |
| A | 12 | 194 | 8067 | 24.62 | 1256 | 1228 | 277.8 |
| A | 0 | 226 | 7966 | 24.26 | 1256 | 1228 | 277.8 |
| B | 3 | 64 | 613131 | 2525.82 | 1258 | 1225 | 242.3 |
| B | 0 | 189 | 395588 | 1627.85 | 1258 | 1225 | 242.3 |
| B | 0 | 229 | 362458 | 1491.09 | 1258 | 1225 | 242.3 |
| C | 7 | 247 | 156567 | 535.57 | 1217 | 1207 | 290.1 |
| C | 10 | 91 | 23467 | 76.74 | 1217 | 1207 | 290.1 |
| C | 3 | 233 | 11692 | 36.14 | 1217 | 1207 | 290.1 |
| D | 1 | 52 | 4407227 | 15343.08 | 1206 | 1158 | 287.2 |
| D | 12 | 233 | 461645 | 1603.54 | 1206 | 1158 | 287.2 |
| D | 7 | 238 | 276014 | 957.12 | 1206 | 1158 | 287.2 |
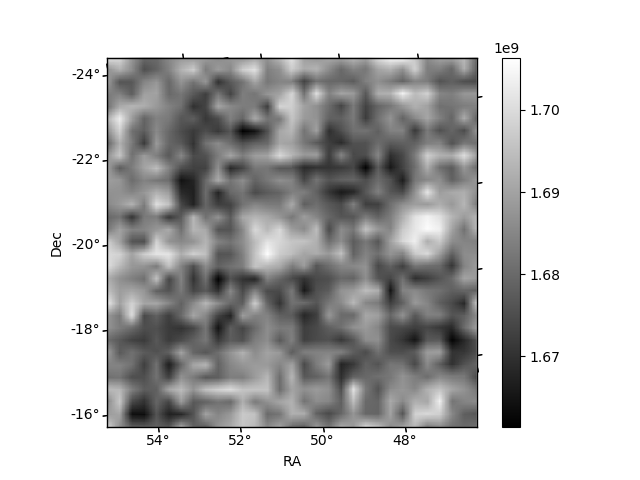
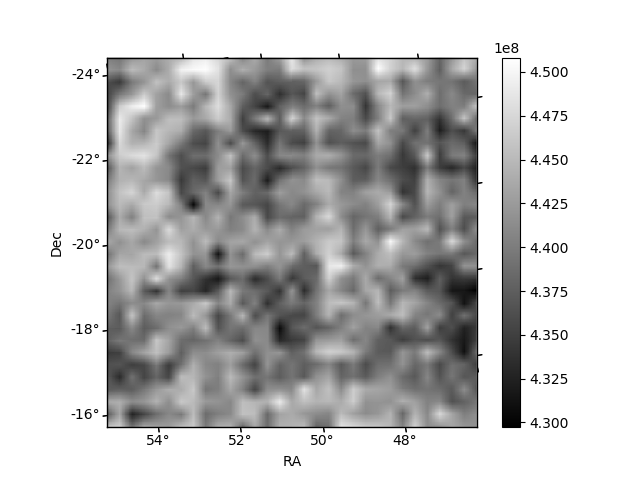
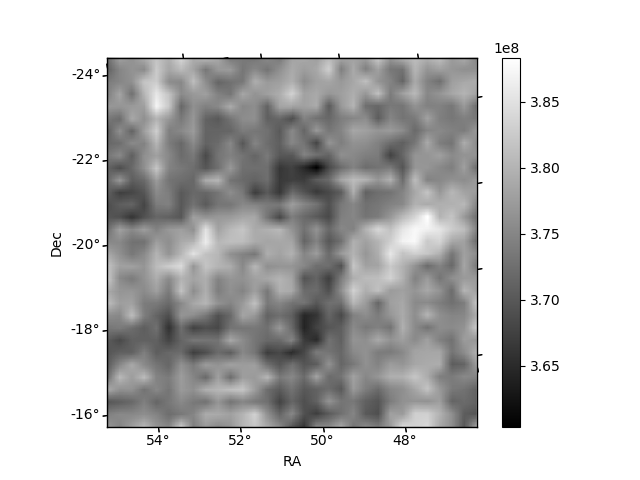
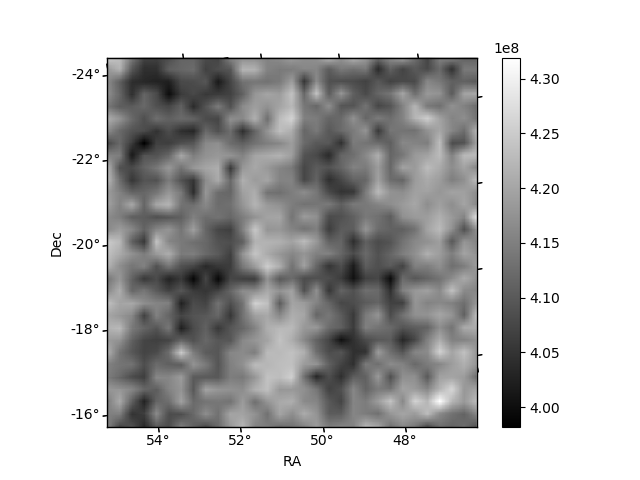
Histogram calculated using DETX and DETY for each event in the final _common_clean file
| Quadrant A |  |
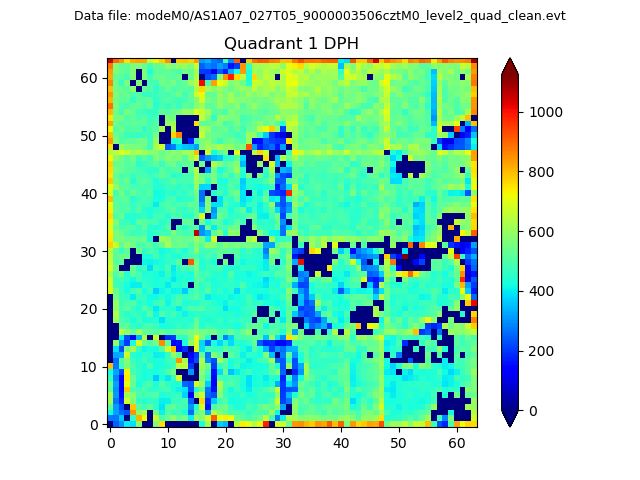 |
Quadrant B |
|---|---|---|---|
| Quadrant D |  |
 |
Quadrant C |
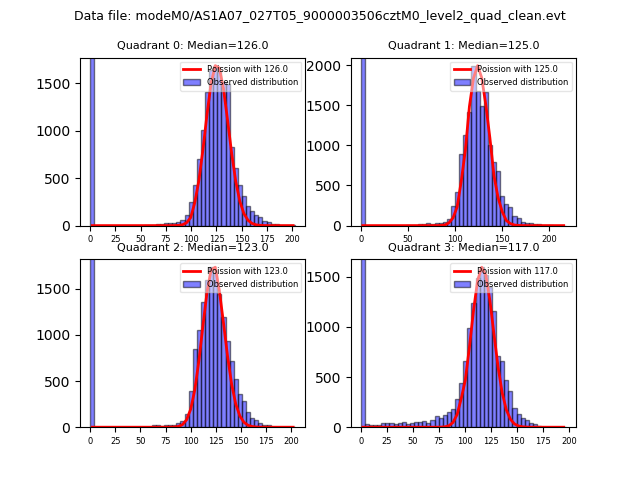
| Plot type | Count rate plots | Images |
|---|---|---|
| Comparison with Poisson distribution Blue bars denote a histogram of data divided into 1 sec bins. Red curve is a Poisson curve with rate = median count rate of data. |
 |
 |
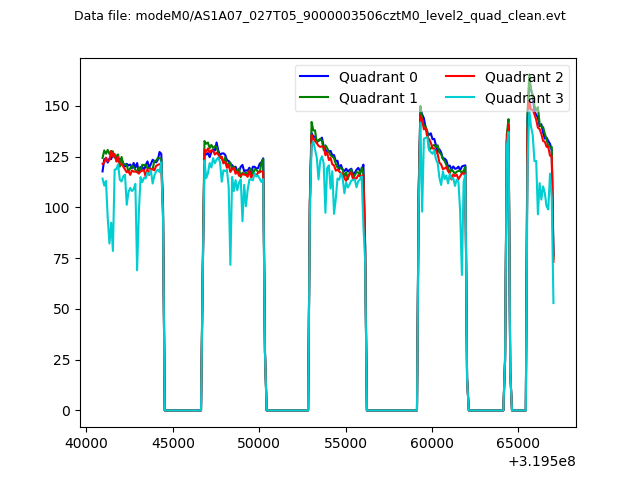
| Quadrant-wise count rates Data is divided into 100 sec bins |
 |
|
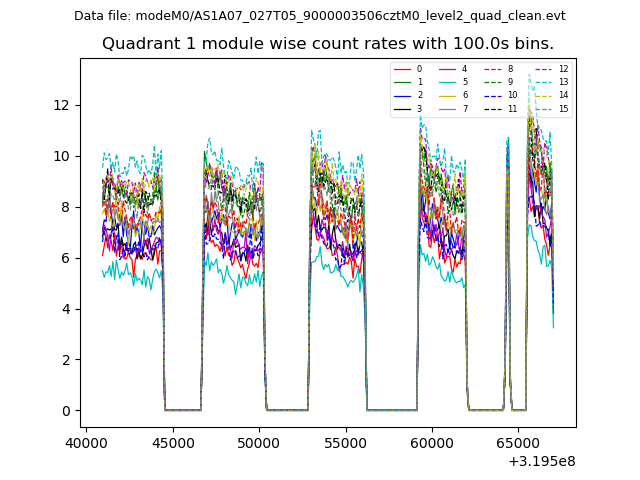
| Module-wise count rates for Quadrant A Data is divided into 100 sec bins |
 |
 |
| Module-wise count rates for Quadrant B Data is divided into 100 sec bins |
 |
 |
| Module-wise count rates for Quadrant C Data is divided into 100 sec bins |
 |
 |
| Module-wise count rates for Quadrant D Data is divided into 100 sec bins |
 |
 |
| Parameter | Plot |
|---|---|
| CZT HV Monitor |  |
| D_VDD |  |
| Temperature 1 |  |
| Veto HV Monitor |  |
| Veto LLD | 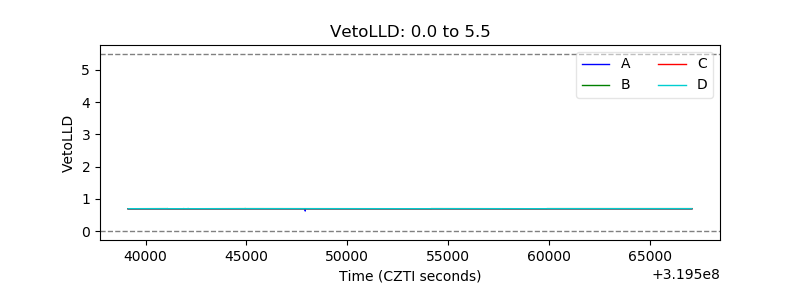 |
| Alpha Counter |  |
| _CPM_Rate |  |
| CZT Counter |  |
| +2.5 Volts monitor | 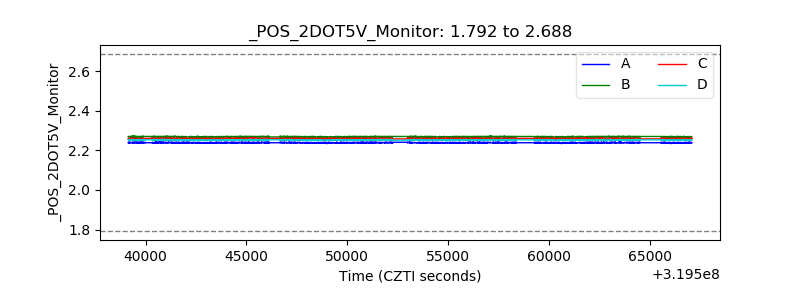 |
| +5 Volts monitor | 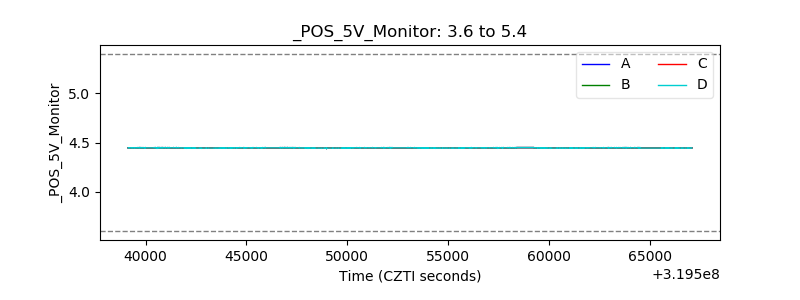 |
| _ROLL_ROT |  |
| _Roll_DEC |  |
| _Roll_RA | 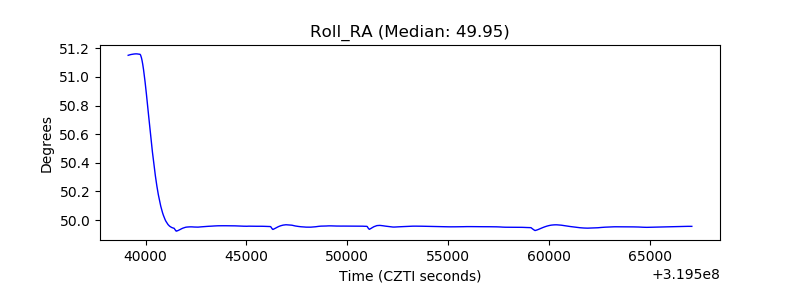 |
| Veto Counter |  |