| Param | Original file | Final file |
|---|---|---|
| Filename | modeM0/AS1A07_054T01_9000003504cztM0_level2_bc.evt | modeM0/AS1A07_054T01_9000003504cztM0_level2_quad_clean.evt |
| Size (bytes) | 2,748,070,080 | 1,409,924,160 |
| Size | 2.6 GB | 1.3 GB |
| Events in quadrant A | 14,850,538 | 9,612,612 |
| Events in quadrant B | 19,508,339 | 9,662,761 |
| Events in quadrant C | 15,224,947 | 9,398,048 |
| Events in quadrant D | 28,648,092 | 9,010,639 |
| Mode M0 | |||
|---|---|---|---|
| Quadrant | BADHDUFLAG | Total packets | Discarded packets |
| A | 0 | 149978 | 0 |
| B | 0 | 164164 | 0 |
| C | 0 | 152772 | 0 |
| D | 0 | 194641 | 0 |
| Mode SS | |||
|---|---|---|---|
| Quadrant | BADHDUFLAG | Total packets | Discarded packets |
| A | 0 | 1494 | 0 |
| B | 0 | 1494 | 0 |
| C | 0 | 1494 | 0 |
| D | 0 | 1494 | 0 |
| Mode M9 | |||
|---|---|---|---|
| Quadrant | BADHDUFLAG | Total packets | Discarded packets |
| A | 0 | 116 | 0 |
| B | 0 | 116 | 0 |
| C | 0 | 116 | 0 |
| D | 0 | 116 | 0 |
| Quadrant | Total seconds | Saturated seconds | Saturation percentage |
|---|---|---|---|
| A | 73309 | 512 | 0.698414% |
| B | 73309 | 1814 | 2.474457% |
| C | 73309 | 1015 | 1.384550% |
| D | 73309 | 2256 | 3.077385% |
Noise dominated data is calculated using 1-second bins in cleaned event files. If a bin has >2000 counts, and if more than 50% of those come from <1% of pixels, then it is considered to be noise-dominated and hence unusable.
| Quadrant | # 1 sec bins | Bins with >0 counts | Bins with >2000 counts | High rate bins dominated by noise | Noise dominated (total time) | Noise dominated (detector-on time) | Marked lightcurve |
|---|---|---|---|---|---|---|---|
| A | 84934 | 73304 | 0 | 0 | 0.00% | 0.00% |  |
| B | 84934 | 73302 | 621 | 621 | 0.73% | 0.85% | 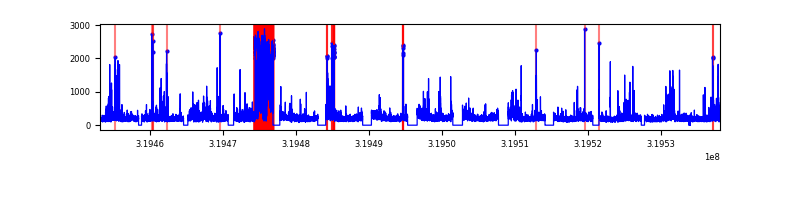 |
| C | 84934 | 73301 | 17 | 17 | 0.02% | 0.02% |  |
| D | 84934 | 73300 | 449 | 449 | 0.53% | 0.61% | 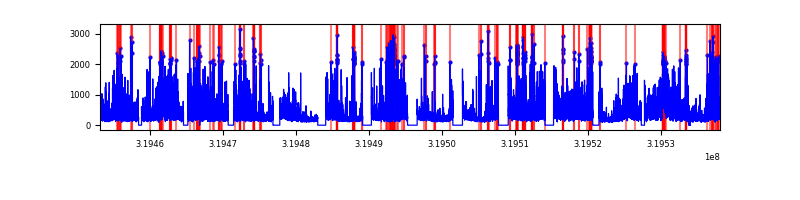 |
Top three noisy pixels from each quadrant. If the there are fewer than three noisy pixels in the level2.evt file, extra rows are filled as -1
| Pixel properties | Quadrant properties | ||||||
|---|---|---|---|---|---|---|---|
| Quadrant | DetID | PixID | Counts | Sigma | Mean | Median | Sigma |
| A | 13 | 254 | 110786 | 128.29 | 3847 | 3781 | 834.1 |
| A | 0 | 226 | 24733 | 25.12 | 3847 | 3781 | 834.1 |
| A | 12 | 194 | 23501 | 23.64 | 3847 | 3781 | 834.1 |
| B | 14 | 207 | 2891412 | 3983.7 | 3867 | 3780 | 724.9 |
| B | 0 | 229 | 483295 | 661.53 | 3867 | 3780 | 724.9 |
| B | 15 | 33 | 351910 | 480.27 | 3867 | 3780 | 724.9 |
| C | 7 | 247 | 618144 | 687.91 | 3748 | 3730 | 893.2 |
| C | 8 | 30 | 72434 | 76.92 | 3748 | 3730 | 893.2 |
| C | 8 | 13 | 45582 | 46.86 | 3748 | 3730 | 893.2 |
| D | 1 | 52 | 9990559 | 11354.93 | 3754 | 3626 | 879.5 |
| D | 7 | 238 | 2039247 | 2314.46 | 3754 | 3626 | 879.5 |
| D | 13 | 174 | 737978 | 834.94 | 3754 | 3626 | 879.5 |
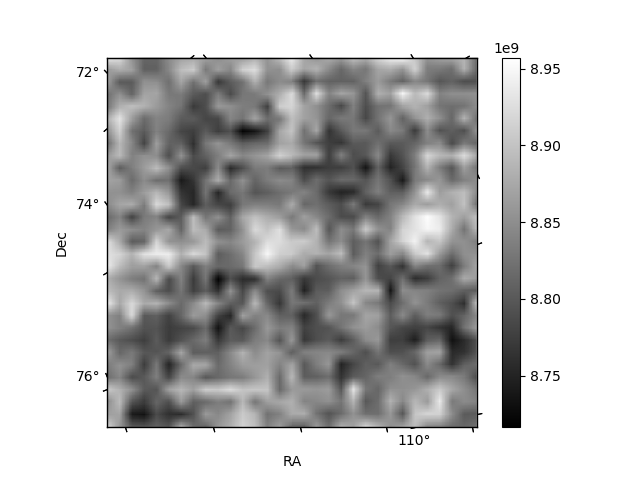
Histogram calculated using DETX and DETY for each event in the final _common_clean file
| Quadrant A |  |
 |
Quadrant B |
|---|---|---|---|
| Quadrant D | 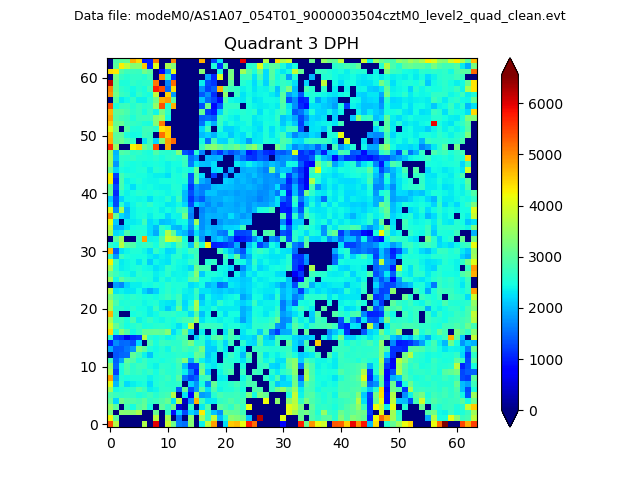 |
 |
Quadrant C |
| Plot type | Count rate plots | Images |
|---|---|---|
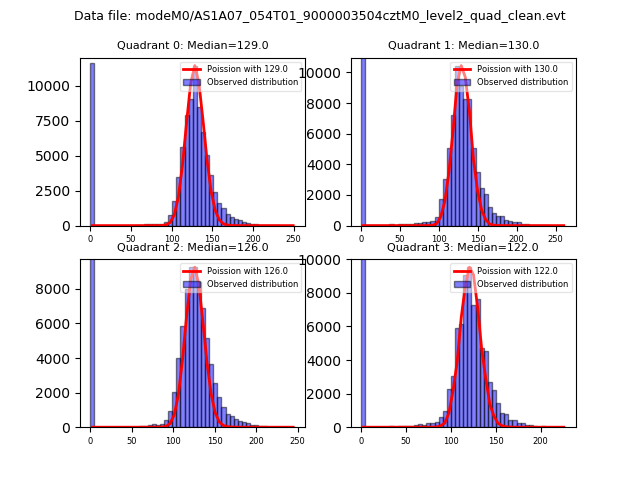
| Comparison with Poisson distribution Blue bars denote a histogram of data divided into 1 sec bins. Red curve is a Poisson curve with rate = median count rate of data. |
 |
 |
| Quadrant-wise count rates Data is divided into 100 sec bins |
 |
|
| Module-wise count rates for Quadrant A Data is divided into 100 sec bins |
 |
 |
| Module-wise count rates for Quadrant B Data is divided into 100 sec bins |
 |
 |
| Module-wise count rates for Quadrant C Data is divided into 100 sec bins |
 |
 |
| Module-wise count rates for Quadrant D Data is divided into 100 sec bins |
 |
 |
| Parameter | Plot |
|---|---|
| CZT HV Monitor |  |
| D_VDD |  |
| Temperature 1 |  |
| Veto HV Monitor |  |
| Veto LLD |  |
| Alpha Counter |  |
| _CPM_Rate |  |
| CZT Counter | 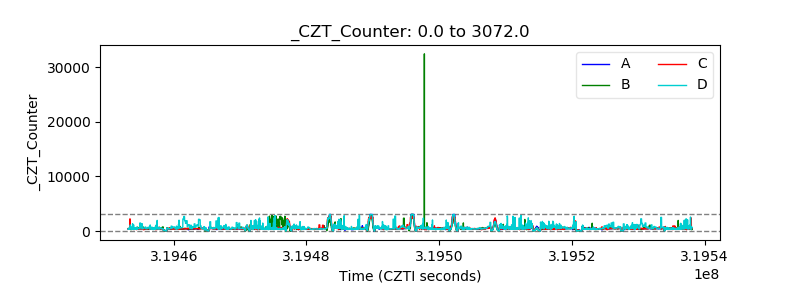 |
| +2.5 Volts monitor |  |
| +5 Volts monitor |  |
| _ROLL_ROT |  |
| _Roll_DEC | 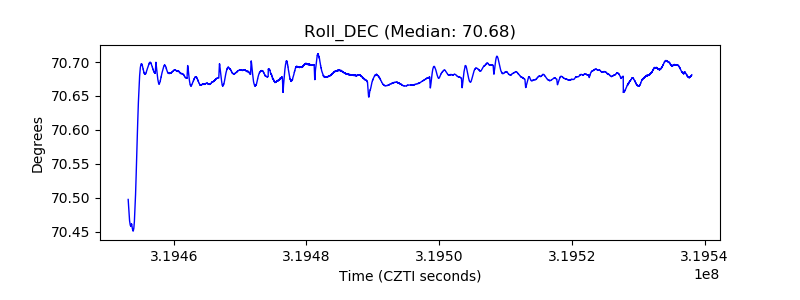 |
| _Roll_RA | 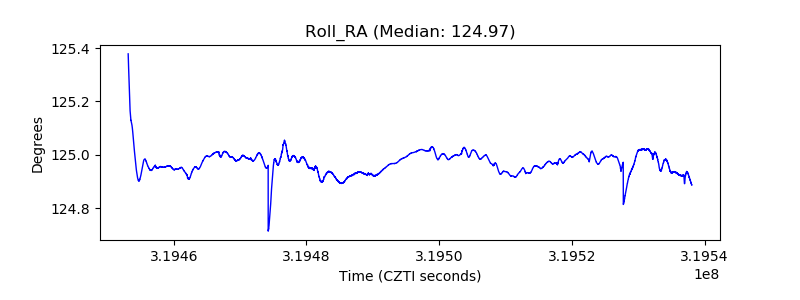 |
| Veto Counter | 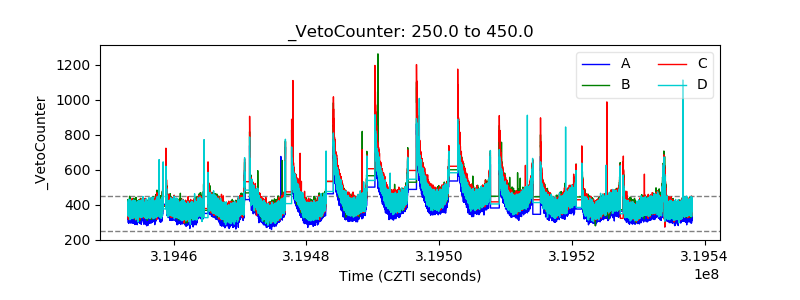 |