| Param | Original file | Final file |
|---|---|---|
| Filename | modeM0/AS1A07_046T01_9000003498cztM0_level2_bc.evt | modeM0/AS1A07_046T01_9000003498cztM0_level2_quad_clean.evt |
| Size (bytes) | 651,349,440 | 255,726,720 |
| Size | 621.2 MB | 243.9 MB |
| Events in quadrant A | 3,733,088 | 1,653,501 |
| Events in quadrant B | 4,014,129 | 1,700,269 |
| Events in quadrant C | 3,844,027 | 1,628,907 |
| Events in quadrant D | 6,937,649 | 1,558,207 |
| Mode M0 | |||
|---|---|---|---|
| Quadrant | BADHDUFLAG | Total packets | Discarded packets |
| A | 0 | 36844 | 0 |
| B | 0 | 38019 | 0 |
| C | 0 | 37797 | 0 |
| D | 0 | 48384 | 0 |
| Mode SS | |||
|---|---|---|---|
| Quadrant | BADHDUFLAG | Total packets | Discarded packets |
| A | 0 | 360 | 0 |
| B | 0 | 360 | 0 |
| C | 0 | 360 | 0 |
| D | 0 | 360 | 0 |
| Mode M9 | |||
|---|---|---|---|
| Quadrant | BADHDUFLAG | Total packets | Discarded packets |
| A | 0 | 49 | 0 |
| B | 0 | 49 | 0 |
| C | 0 | 49 | 0 |
| D | 0 | 49 | 0 |
| Quadrant | Total seconds | Saturated seconds | Saturation percentage |
|---|---|---|---|
| A | 17476 | 154 | 0.881209% |
| B | 17476 | 219 | 1.253147% |
| C | 17476 | 291 | 1.665141% |
| D | 17475 | 1079 | 6.174535% |
Noise dominated data is calculated using 1-second bins in cleaned event files. If a bin has >2000 counts, and if more than 50% of those come from <1% of pixels, then it is considered to be noise-dominated and hence unusable.
| Quadrant | # 1 sec bins | Bins with >0 counts | Bins with >2000 counts | High rate bins dominated by noise | Noise dominated (total time) | Noise dominated (detector-on time) | Marked lightcurve |
|---|---|---|---|---|---|---|---|
| A | 39463 | 17474 | 0 | 0 | 0.00% | 0.00% | 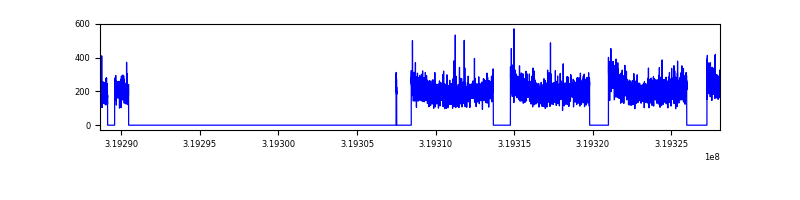 |
| B | 39463 | 17473 | 2 | 2 | 0.01% | 0.01% |  |
| C | 39463 | 17474 | 0 | 0 | 0.00% | 0.00% |  |
| D | 39463 | 17473 | 287 | 287 | 0.73% | 1.64% | 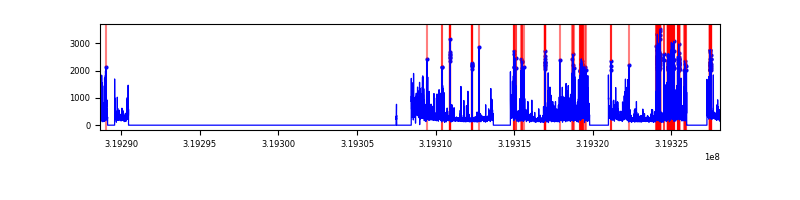 |
Top three noisy pixels from each quadrant. If the there are fewer than three noisy pixels in the level2.evt file, extra rows are filled as -1
| Pixel properties | Quadrant properties | ||||||
|---|---|---|---|---|---|---|---|
| Quadrant | DetID | PixID | Counts | Sigma | Mean | Median | Sigma |
| A | 13 | 254 | 28454 | 131.01 | 966 | 946 | 210.0 |
| A | 0 | 226 | 6158 | 24.82 | 966 | 946 | 210.0 |
| A | 12 | 194 | 5974 | 23.94 | 966 | 946 | 210.0 |
| B | 0 | 230 | 79624 | 421.55 | 987 | 962 | 186.6 |
| B | 0 | 189 | 45699 | 239.74 | 987 | 962 | 186.6 |
| B | 0 | 228 | 24101 | 124.0 | 987 | 962 | 186.6 |
| C | 7 | 247 | 148735 | 665.76 | 945 | 940 | 222.0 |
| C | 10 | 9 | 19535 | 83.76 | 945 | 940 | 222.0 |
| C | 0 | 10 | 16144 | 68.49 | 945 | 940 | 222.0 |
| D | 1 | 52 | 2539194 | 11752.93 | 934 | 901 | 216.0 |
| D | 12 | 233 | 429872 | 1986.24 | 934 | 901 | 216.0 |
| D | 12 | 235 | 133336 | 613.21 | 934 | 901 | 216.0 |
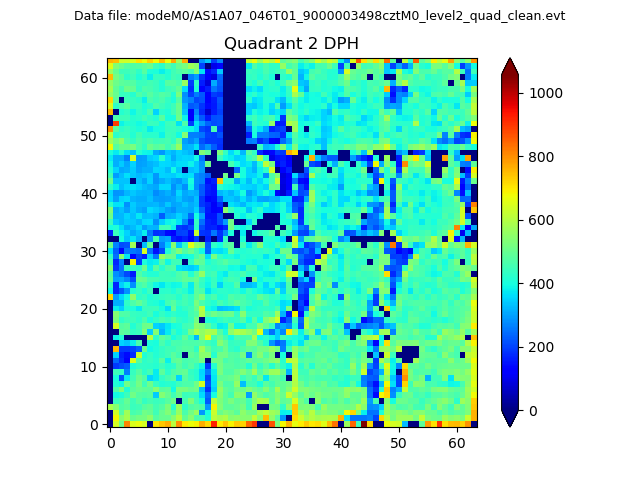
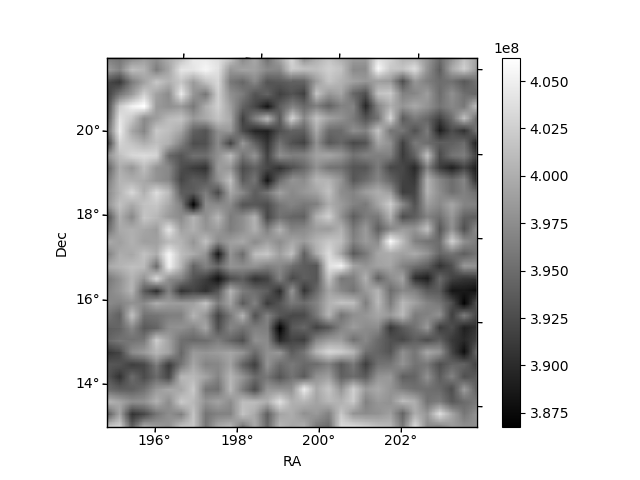
Histogram calculated using DETX and DETY for each event in the final _common_clean file
| Quadrant A |  |
 |
Quadrant B |
|---|---|---|---|
| Quadrant D | 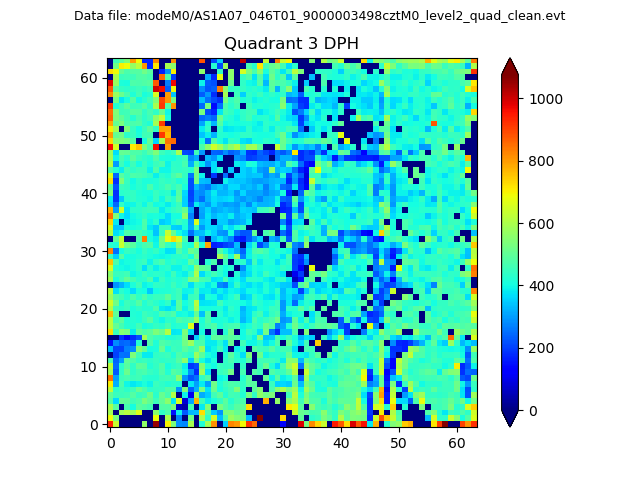 |
 |
Quadrant C |
| Plot type | Count rate plots | Images |
|---|---|---|
| Comparison with Poisson distribution Blue bars denote a histogram of data divided into 1 sec bins. Red curve is a Poisson curve with rate = median count rate of data. |
 |
 |
| Quadrant-wise count rates Data is divided into 100 sec bins |
 |
|
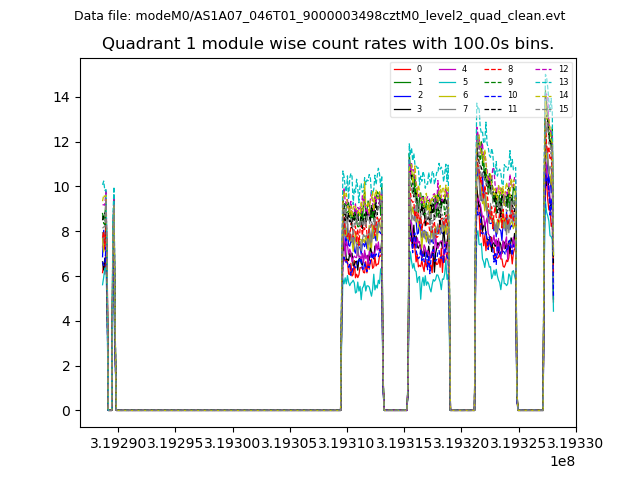
| Module-wise count rates for Quadrant A Data is divided into 100 sec bins |
 |
 |
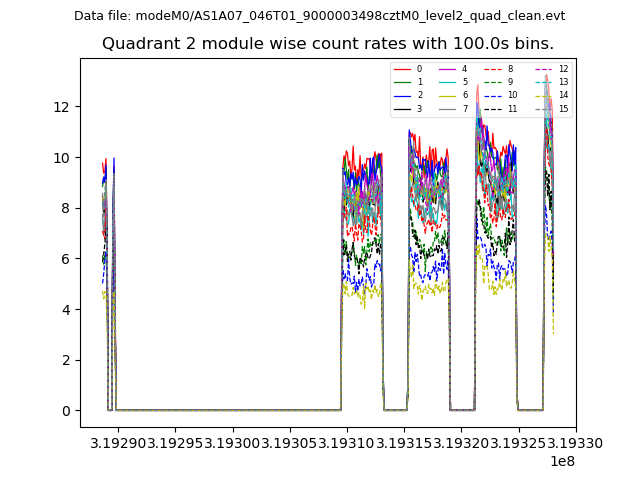
| Module-wise count rates for Quadrant B Data is divided into 100 sec bins |
 |
 |
| Module-wise count rates for Quadrant C Data is divided into 100 sec bins |
 |
 |
| Module-wise count rates for Quadrant D Data is divided into 100 sec bins |
 |
 |
| Parameter | Plot |
|---|---|
| CZT HV Monitor |  |
| D_VDD |  |
| Temperature 1 |  |
| Veto HV Monitor |  |
| Veto LLD |  |
| Alpha Counter |  |
| _CPM_Rate |  |
| CZT Counter |  |
| +2.5 Volts monitor |  |
| +5 Volts monitor | 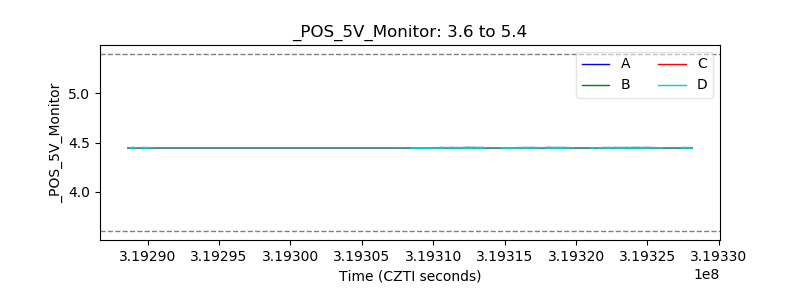 |
| _ROLL_ROT | 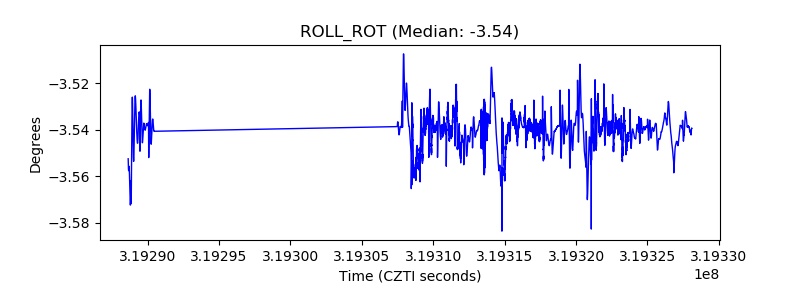 |
| _Roll_DEC |  |
| _Roll_RA |  |
| Veto Counter |  |