| Param | Original file | Final file |
|---|---|---|
| Filename | modeM0/AS1A08_004T02_9000003496cztM0_level2_bc.evt | modeM0/AS1A08_004T02_9000003496cztM0_level2_quad_clean.evt |
| Size (bytes) | 1,910,831,040 | 738,204,480 |
| Size | 1.8 GB | 704.0 MB |
| Events in quadrant A | 10,412,598 | 4,845,260 |
| Events in quadrant B | 14,989,495 | 4,876,895 |
| Events in quadrant C | 10,439,879 | 4,773,543 |
| Events in quadrant D | 18,661,175 | 4,476,382 |
| Mode M9 | |||
|---|---|---|---|
| Quadrant | BADHDUFLAG | Total packets | Discarded packets |
| A | 0 | 88 | 0 |
| B | 0 | 88 | 0 |
| C | 0 | 88 | 0 |
| D | 0 | 88 | 0 |
| Mode M0 | |||
|---|---|---|---|
| Quadrant | BADHDUFLAG | Total packets | Discarded packets |
| A | 0 | 101516 | 0 |
| B | 0 | 118498 | 0 |
| C | 0 | 102606 | 0 |
| D | 0 | 131127 | 0 |
| Mode SS | |||
|---|---|---|---|
| Quadrant | BADHDUFLAG | Total packets | Discarded packets |
| A | 0 | 1002 | 0 |
| B | 0 | 1002 | 0 |
| C | 0 | 1002 | 0 |
| D | 0 | 1002 | 0 |
| Quadrant | Total seconds | Saturated seconds | Saturation percentage |
|---|---|---|---|
| A | 49385 | 534 | 1.081300% |
| B | 49384 | 1956 | 3.960797% |
| C | 49380 | 862 | 1.745646% |
| D | 49380 | 2664 | 5.394897% |
Noise dominated data is calculated using 1-second bins in cleaned event files. If a bin has >2000 counts, and if more than 50% of those come from <1% of pixels, then it is considered to be noise-dominated and hence unusable.
| Quadrant | # 1 sec bins | Bins with >0 counts | Bins with >2000 counts | High rate bins dominated by noise | Noise dominated (total time) | Noise dominated (detector-on time) | Marked lightcurve |
|---|---|---|---|---|---|---|---|
| A | 58005 | 49388 | 3 | 3 | 0.01% | 0.01% |  |
| B | 58005 | 49382 | 115 | 115 | 0.20% | 0.23% |  |
| C | 58005 | 49386 | 1 | 1 | 0.00% | 0.00% |  |
| D | 58005 | 49384 | 409 | 409 | 0.71% | 0.83% |  |
Top three noisy pixels from each quadrant. If the there are fewer than three noisy pixels in the level2.evt file, extra rows are filled as -1
| Pixel properties | Quadrant properties | ||||||
|---|---|---|---|---|---|---|---|
| Quadrant | DetID | PixID | Counts | Sigma | Mean | Median | Sigma |
| A | 13 | 254 | 81988 | 136.0 | 2679 | 2633 | 583.5 |
| A | 12 | 96 | 65954 | 108.52 | 2679 | 2633 | 583.5 |
| A | 0 | 226 | 16894 | 24.44 | 2679 | 2633 | 583.5 |
| B | 3 | 64 | 3258021 | 6467.9 | 2694 | 2636 | 503.3 |
| B | 0 | 189 | 496947 | 982.11 | 2694 | 2636 | 503.3 |
| B | 0 | 230 | 278292 | 547.68 | 2694 | 2636 | 503.3 |
| C | 7 | 247 | 296472 | 475.76 | 2612 | 2608 | 617.7 |
| C | 10 | 9 | 46216 | 70.6 | 2612 | 2608 | 617.7 |
| C | 10 | 23 | 21818 | 31.1 | 2612 | 2608 | 617.7 |
| D | 1 | 52 | 4203723 | 6973.94 | 2585 | 2497 | 602.4 |
| D | 12 | 233 | 1767901 | 2930.53 | 2585 | 2497 | 602.4 |
| D | 9 | 85 | 1039105 | 1720.75 | 2585 | 2497 | 602.4 |
Histogram calculated using DETX and DETY for each event in the final _common_clean file
| Quadrant A | 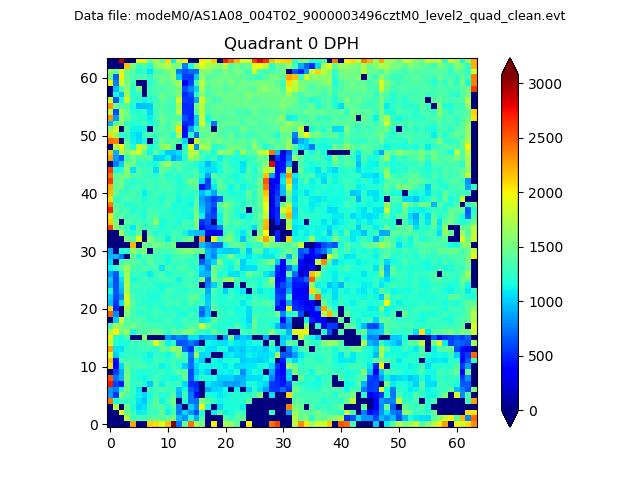 |
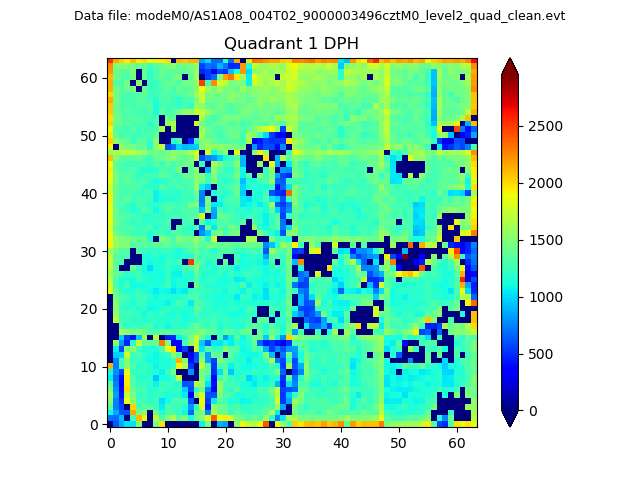 |
Quadrant B |
|---|---|---|---|
| Quadrant D |  |
 |
Quadrant C |
| Plot type | Count rate plots | Images |
|---|---|---|
| Comparison with Poisson distribution Blue bars denote a histogram of data divided into 1 sec bins. Red curve is a Poisson curve with rate = median count rate of data. |
 |
 |
| Quadrant-wise count rates Data is divided into 100 sec bins |
 |
|
| Module-wise count rates for Quadrant A Data is divided into 100 sec bins |
 |
 |
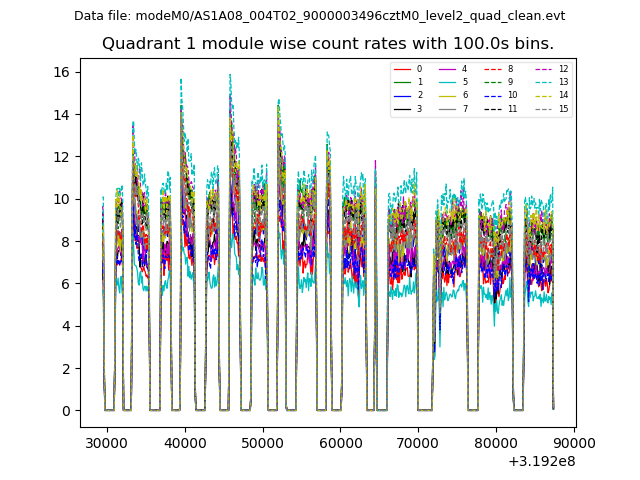
| Module-wise count rates for Quadrant B Data is divided into 100 sec bins |
 |
 |
| Module-wise count rates for Quadrant C Data is divided into 100 sec bins |
 |
 |
| Module-wise count rates for Quadrant D Data is divided into 100 sec bins |
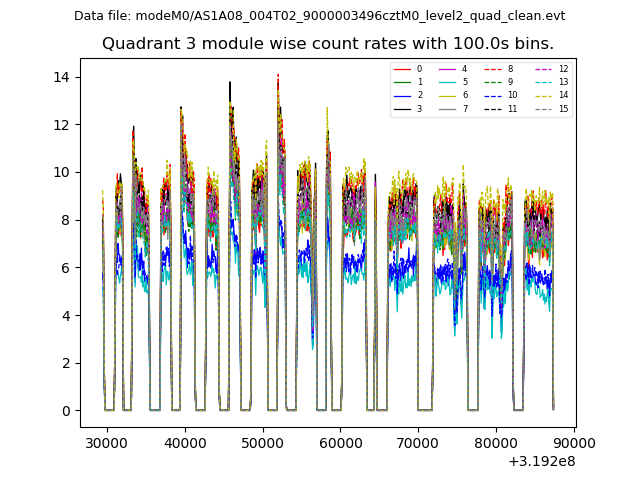 |
 |
| Parameter | Plot |
|---|---|
| CZT HV Monitor |  |
| D_VDD |  |
| Temperature 1 | 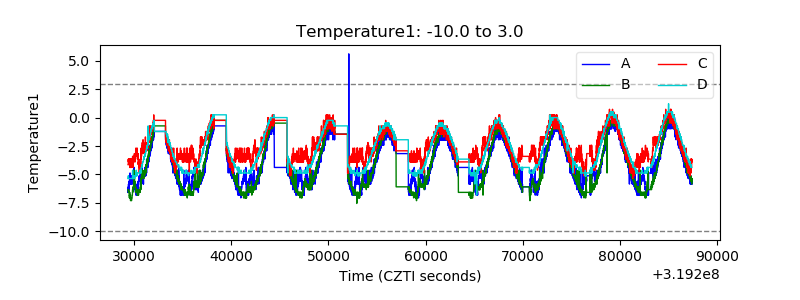 |
| Veto HV Monitor |  |
| Veto LLD |  |
| Alpha Counter |  |
| _CPM_Rate |  |
| CZT Counter |  |
| +2.5 Volts monitor | 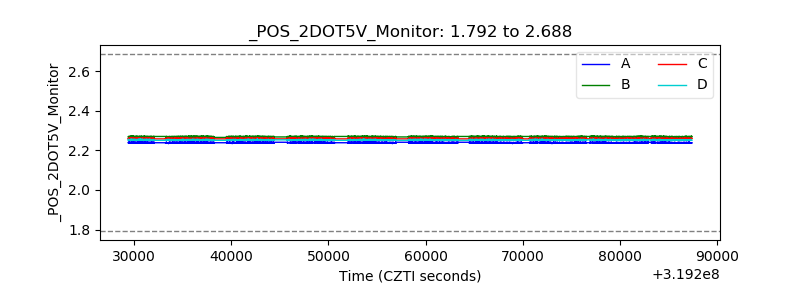 |
| +5 Volts monitor |  |
| _ROLL_ROT | 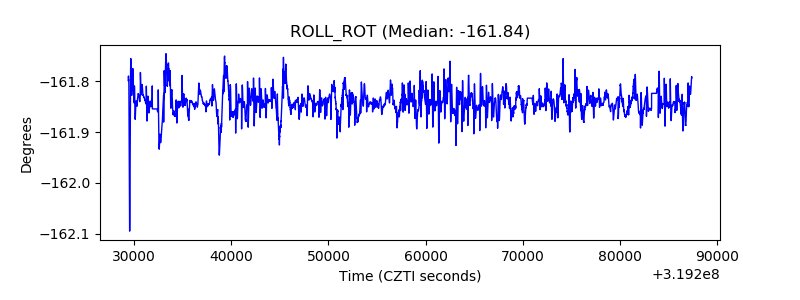 |
| _Roll_DEC |  |
| _Roll_RA |  |
| Veto Counter | 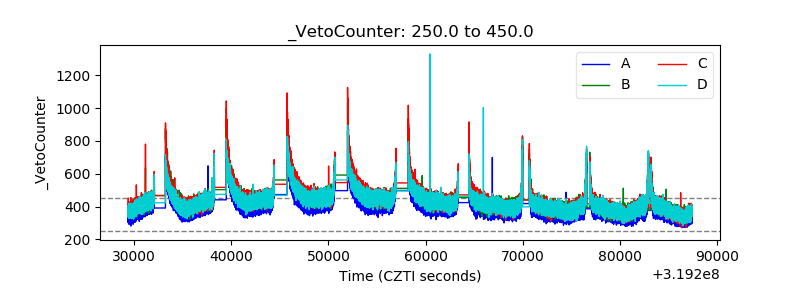 |