| Param | Original file | Final file |
|---|---|---|
| Filename | modeM0/AS1A07_160T07_9000003494cztM0_level2_bc.evt | modeM0/AS1A07_160T07_9000003494cztM0_level2_quad_clean.evt |
| Size (bytes) | 1,015,689,600 | 393,819,840 |
| Size | 968.6 MB | 375.6 MB |
| Events in quadrant A | 5,967,807 | 2,492,802 |
| Events in quadrant B | 7,591,224 | 2,514,146 |
| Events in quadrant C | 5,846,925 | 2,446,169 |
| Events in quadrant D | 9,273,528 | 2,383,335 |
| Mode SS | |||
|---|---|---|---|
| Quadrant | BADHDUFLAG | Total packets | Discarded packets |
| A | 0 | 624 | 0 |
| B | 0 | 624 | 0 |
| C | 0 | 624 | 0 |
| D | 0 | 624 | 0 |
| Mode M0 | |||
|---|---|---|---|
| Quadrant | BADHDUFLAG | Total packets | Discarded packets |
| A | 0 | 62629 | 0 |
| B | 0 | 68089 | 0 |
| C | 0 | 62908 | 0 |
| D | 0 | 74456 | 0 |
| Mode M9 | |||
|---|---|---|---|
| Quadrant | BADHDUFLAG | Total packets | Discarded packets |
| A | 0 | 34 | 0 |
| B | 0 | 34 | 0 |
| C | 0 | 34 | 0 |
| D | 0 | 34 | 0 |
| Quadrant | Total seconds | Saturated seconds | Saturation percentage |
|---|---|---|---|
| A | 30417 | 474 | 1.558339% |
| B | 30417 | 835 | 2.745175% |
| C | 30417 | 651 | 2.140251% |
| D | 30417 | 1384 | 4.550087% |
Noise dominated data is calculated using 1-second bins in cleaned event files. If a bin has >2000 counts, and if more than 50% of those come from <1% of pixels, then it is considered to be noise-dominated and hence unusable.
| Quadrant | # 1 sec bins | Bins with >0 counts | Bins with >2000 counts | High rate bins dominated by noise | Noise dominated (total time) | Noise dominated (detector-on time) | Marked lightcurve |
|---|---|---|---|---|---|---|---|
| A | 33952 | 30412 | 0 | 0 | 0.00% | 0.00% |  |
| B | 33952 | 30410 | 32 | 32 | 0.09% | 0.11% |  |
| C | 33952 | 30411 | 0 | 0 | 0.00% | 0.00% |  |
| D | 33952 | 30411 | 113 | 113 | 0.33% | 0.37% |  |
Top three noisy pixels from each quadrant. If the there are fewer than three noisy pixels in the level2.evt file, extra rows are filled as -1
| Pixel properties | Quadrant properties | ||||||
|---|---|---|---|---|---|---|---|
| Quadrant | DetID | PixID | Counts | Sigma | Mean | Median | Sigma |
| A | 13 | 254 | 49361 | 140.93 | 1540 | 1506 | 339.6 |
| A | 12 | 194 | 10381 | 26.14 | 1540 | 1506 | 339.6 |
| A | 0 | 226 | 9786 | 24.38 | 1540 | 1506 | 339.6 |
| B | 3 | 64 | 994295 | 3296.89 | 1552 | 1512 | 301.1 |
| B | 0 | 229 | 218187 | 719.55 | 1552 | 1512 | 301.1 |
| B | 0 | 189 | 183536 | 604.48 | 1552 | 1512 | 301.1 |
| C | 7 | 247 | 95013 | 260.43 | 1496 | 1481 | 359.1 |
| C | 13 | 61 | 8506 | 19.56 | 1496 | 1481 | 359.1 |
| C | 14 | 238 | 4902 | 9.53 | 1496 | 1481 | 359.1 |
| D | 1 | 52 | 1740450 | 4902.7 | 1507 | 1449 | 354.7 |
| D | 12 | 233 | 587268 | 1651.58 | 1507 | 1449 | 354.7 |
| D | 9 | 85 | 492494 | 1384.38 | 1507 | 1449 | 354.7 |
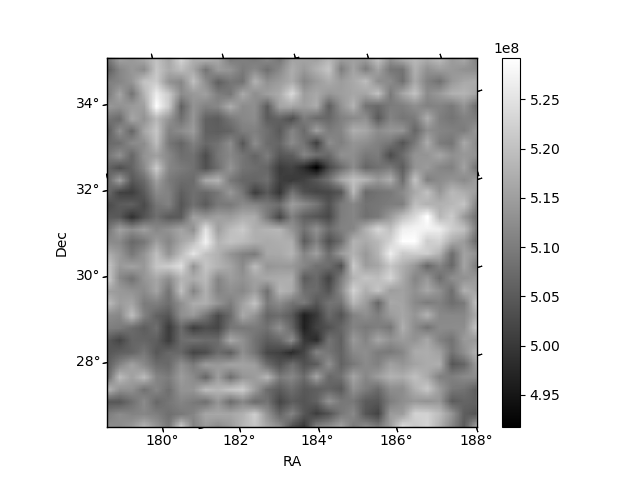
Histogram calculated using DETX and DETY for each event in the final _common_clean file
| Quadrant A |  |
 |
Quadrant B |
|---|---|---|---|
| Quadrant D |  |
 |
Quadrant C |
| Plot type | Count rate plots | Images |
|---|---|---|
| Comparison with Poisson distribution Blue bars denote a histogram of data divided into 1 sec bins. Red curve is a Poisson curve with rate = median count rate of data. |
 |
 |
| Quadrant-wise count rates Data is divided into 100 sec bins |
 |
|
| Module-wise count rates for Quadrant A Data is divided into 100 sec bins |
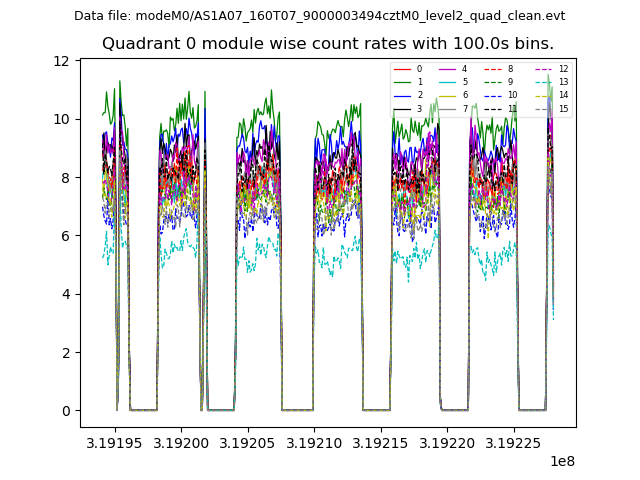 |
 |
| Module-wise count rates for Quadrant B Data is divided into 100 sec bins |
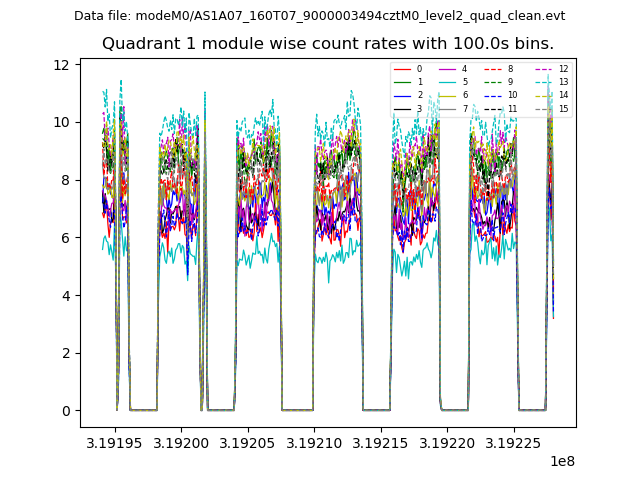 |
 |
| Module-wise count rates for Quadrant C Data is divided into 100 sec bins |
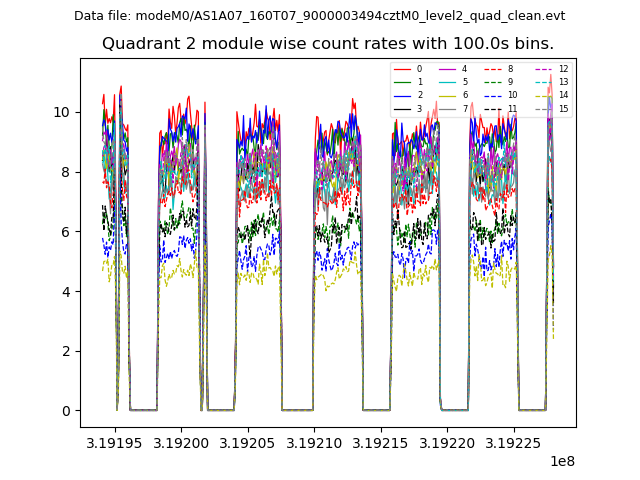 |
 |
| Module-wise count rates for Quadrant D Data is divided into 100 sec bins |
 |
 |
| Parameter | Plot |
|---|---|
| CZT HV Monitor |  |
| D_VDD |  |
| Temperature 1 |  |
| Veto HV Monitor |  |
| Veto LLD | 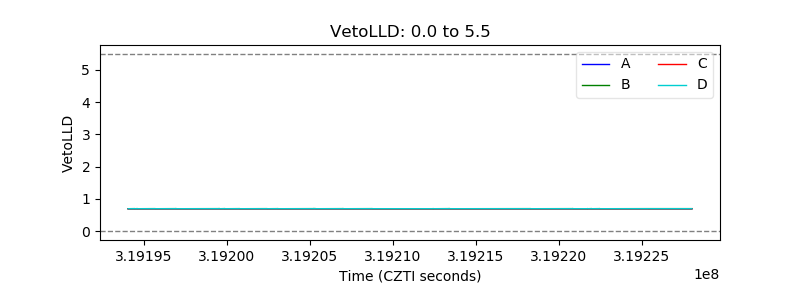 |
| Alpha Counter |  |
| _CPM_Rate |  |
| CZT Counter |  |
| +2.5 Volts monitor |  |
| +5 Volts monitor | 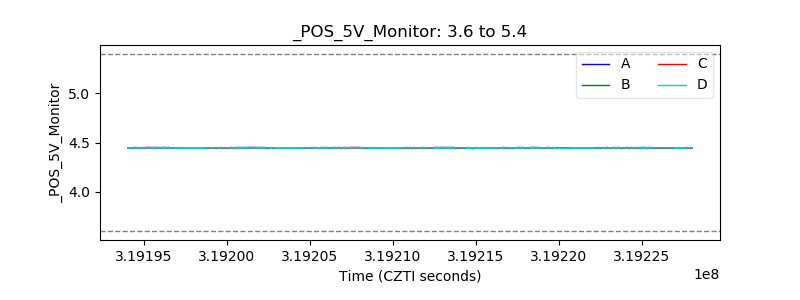 |
| _ROLL_ROT |  |
| _Roll_DEC | 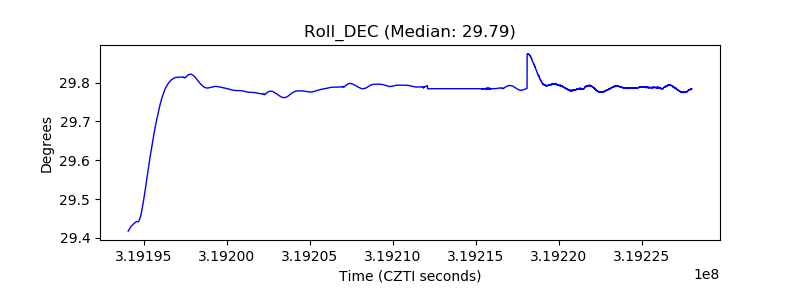 |
| _Roll_RA |  |
| Veto Counter |  |