| Param | Original file | Final file |
|---|---|---|
| Filename | modeM0/AS1A07_091T04_9000003492cztM0_level2_bc.evt | modeM0/AS1A07_091T04_9000003492cztM0_level2_quad_clean.evt |
| Size (bytes) | 1,181,416,320 | 460,304,640 |
| Size | 1.1 GB | 439.0 MB |
| Events in quadrant A | 7,003,478 | 2,932,639 |
| Events in quadrant B | 9,192,010 | 3,013,374 |
| Events in quadrant C | 6,962,595 | 2,903,742 |
| Events in quadrant D | 10,330,074 | 2,787,690 |
| Mode M9 | |||
|---|---|---|---|
| Quadrant | BADHDUFLAG | Total packets | Discarded packets |
| A | 0 | 63 | 0 |
| B | 0 | 63 | 0 |
| C | 0 | 63 | 0 |
| D | 0 | 63 | 0 |
| Mode M0 | |||
|---|---|---|---|
| Quadrant | BADHDUFLAG | Total packets | Discarded packets |
| A | 0 | 69161 | 0 |
| B | 0 | 76850 | 0 |
| C | 0 | 70078 | 0 |
| D | 0 | 82331 | 0 |
| Mode SS | |||
|---|---|---|---|
| Quadrant | BADHDUFLAG | Total packets | Discarded packets |
| A | 0 | 684 | 0 |
| B | 0 | 684 | 0 |
| C | 0 | 684 | 0 |
| D | 0 | 684 | 0 |
| Quadrant | Total seconds | Saturated seconds | Saturation percentage |
|---|---|---|---|
| A | 33544 | 325 | 0.968877% |
| B | 33542 | 812 | 2.420846% |
| C | 33544 | 531 | 1.582995% |
| D | 33544 | 1070 | 3.189840% |
Noise dominated data is calculated using 1-second bins in cleaned event files. If a bin has >2000 counts, and if more than 50% of those come from <1% of pixels, then it is considered to be noise-dominated and hence unusable.
| Quadrant | # 1 sec bins | Bins with >0 counts | Bins with >2000 counts | High rate bins dominated by noise | Noise dominated (total time) | Noise dominated (detector-on time) | Marked lightcurve |
|---|---|---|---|---|---|---|---|
| A | 45471 | 33546 | 0 | 0 | 0.00% | 0.00% |  |
| B | 45471 | 33539 | 43 | 43 | 0.09% | 0.13% |  |
| C | 45471 | 33544 | 0 | 0 | 0.00% | 0.00% |  |
| D | 45471 | 33541 | 53 | 53 | 0.12% | 0.16% |  |
Top three noisy pixels from each quadrant. If the there are fewer than three noisy pixels in the level2.evt file, extra rows are filled as -1
| Pixel properties | Quadrant properties | ||||||
|---|---|---|---|---|---|---|---|
| Quadrant | DetID | PixID | Counts | Sigma | Mean | Median | Sigma |
| A | 13 | 254 | 51206 | 125.69 | 1814 | 1782 | 393.2 |
| A | 0 | 226 | 11440 | 24.56 | 1814 | 1782 | 393.2 |
| A | 12 | 194 | 11094 | 23.68 | 1814 | 1782 | 393.2 |
| B | 0 | 229 | 915255 | 2646.77 | 1841 | 1802 | 345.1 |
| B | 0 | 189 | 642636 | 1856.85 | 1841 | 1802 | 345.1 |
| B | 3 | 64 | 384039 | 1107.55 | 1841 | 1802 | 345.1 |
| C | 7 | 247 | 123829 | 294.35 | 1762 | 1754 | 414.7 |
| C | 3 | 233 | 44763 | 103.7 | 1762 | 1754 | 414.7 |
| C | 10 | 9 | 17554 | 38.1 | 1762 | 1754 | 414.7 |
| D | 9 | 85 | 1478098 | 3590.09 | 1767 | 1708 | 411.2 |
| D | 1 | 52 | 1109005 | 2692.58 | 1767 | 1708 | 411.2 |
| D | 12 | 233 | 378846 | 917.07 | 1767 | 1708 | 411.2 |
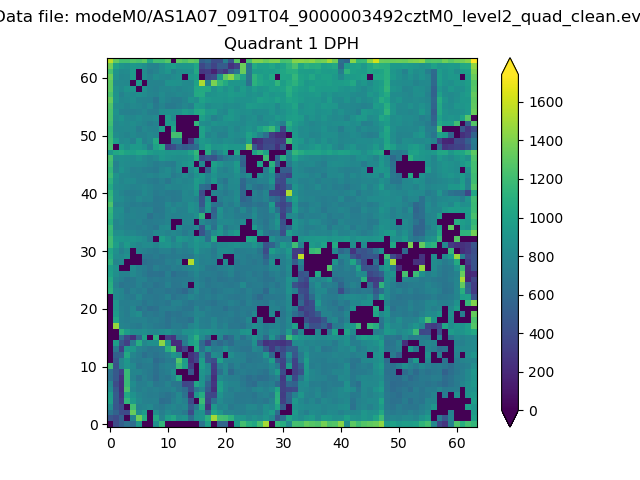
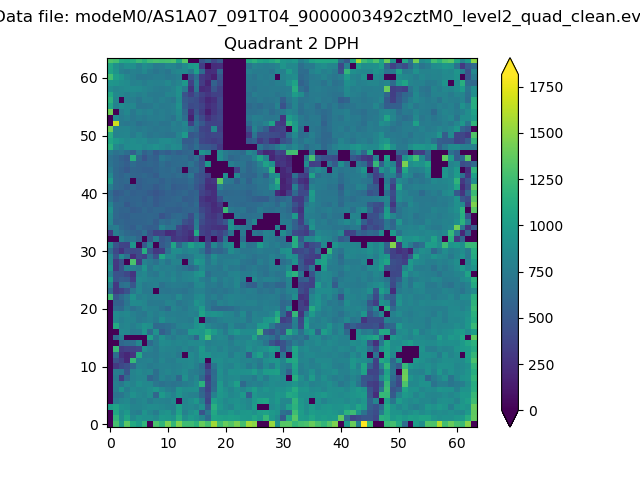
Histogram calculated using DETX and DETY for each event in the final _common_clean file
| Quadrant A |  |
 |
Quadrant B |
|---|---|---|---|
| Quadrant D |  |
 |
Quadrant C |
| Plot type | Count rate plots | Images |
|---|---|---|
| Comparison with Poisson distribution Blue bars denote a histogram of data divided into 1 sec bins. Red curve is a Poisson curve with rate = median count rate of data. |
 |
 |
| Quadrant-wise count rates Data is divided into 100 sec bins |
 |
|
| Module-wise count rates for Quadrant A Data is divided into 100 sec bins |
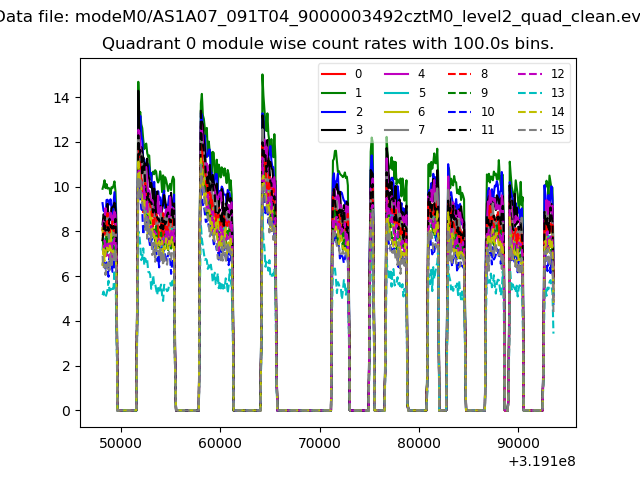 |
 |
| Module-wise count rates for Quadrant B Data is divided into 100 sec bins |
 |
 |
| Module-wise count rates for Quadrant C Data is divided into 100 sec bins |
 |
 |
| Module-wise count rates for Quadrant D Data is divided into 100 sec bins |
 |
 |
| Parameter | Plot |
|---|---|
| CZT HV Monitor | 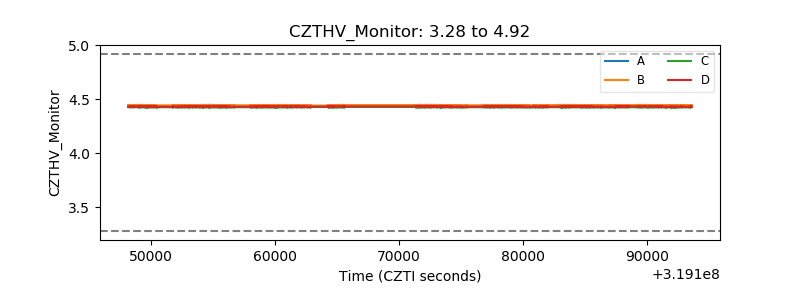 |
| D_VDD |  |
| Temperature 1 | 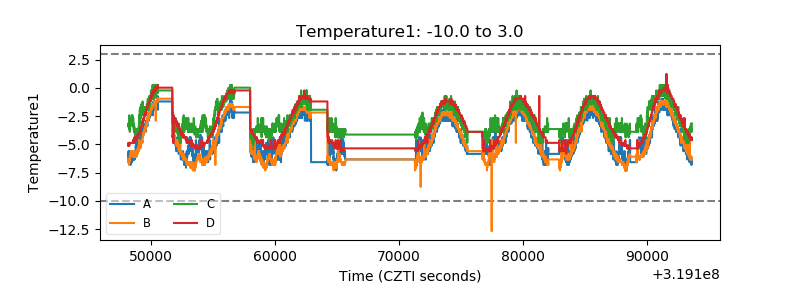 |
| Veto HV Monitor | 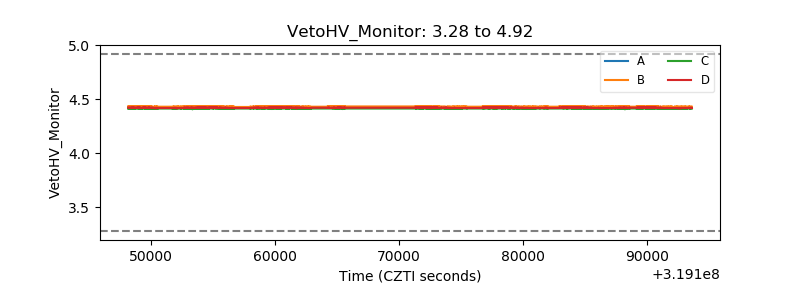 |
| Veto LLD | 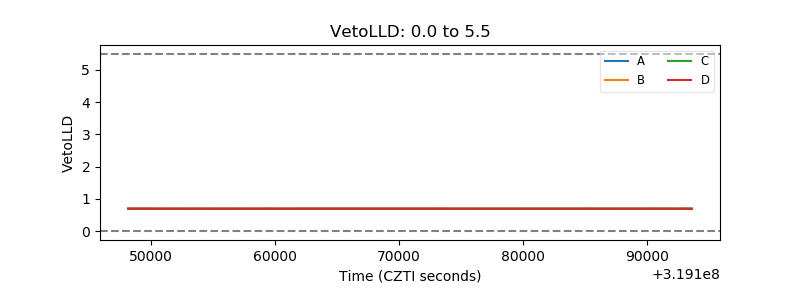 |
| Alpha Counter |  |
| _CPM_Rate |  |
| CZT Counter |  |
| +2.5 Volts monitor |  |
| +5 Volts monitor | 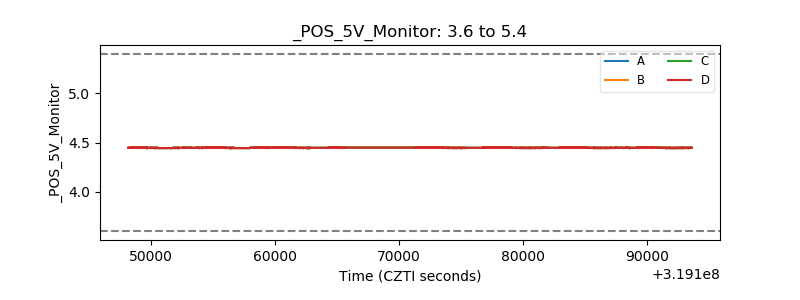 |
| _ROLL_ROT | 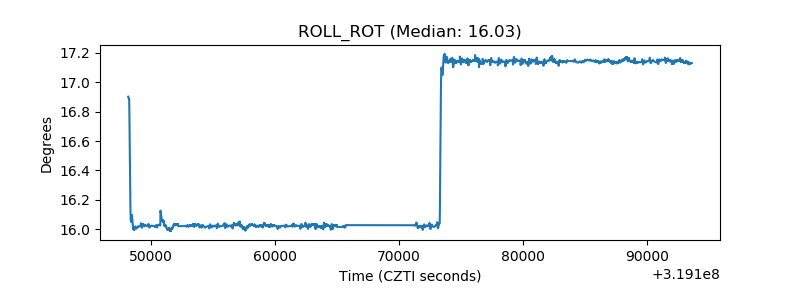 |
| _Roll_DEC |  |
| _Roll_RA |  |
| Veto Counter |  |