| Param | Original file | Final file |
|---|---|---|
| Filename | modeM0/AS1A07_147T01_9000003490cztM0_level2_bc.evt | modeM0/AS1A07_147T01_9000003490cztM0_level2_quad_clean.evt |
| Size (bytes) | 4,276,232,640 | 1,239,396,480 |
| Size | 4.0 GB | 1.2 GB |
| Events in quadrant A | 20,037,420 | 7,901,541 |
| Events in quadrant B | 28,178,892 | 8,015,586 |
| Events in quadrant C | 20,134,445 | 7,714,759 |
| Events in quadrant D | 54,552,210 | 7,260,508 |
| Mode M9 | |||
|---|---|---|---|
| Quadrant | BADHDUFLAG | Total packets | Discarded packets |
| A | 0 | 136 | 0 |
| B | 0 | 137 | 0 |
| C | 0 | 137 | 0 |
| D | 0 | 137 | 0 |
| Mode SS | |||
|---|---|---|---|
| Quadrant | BADHDUFLAG | Total packets | Discarded packets |
| A | 0 | 1976 | 0 |
| B | 0 | 1976 | 0 |
| C | 0 | 1976 | 0 |
| D | 0 | 1976 | 0 |
| Mode M0 | |||
|---|---|---|---|
| Quadrant | BADHDUFLAG | Total packets | Discarded packets |
| A | 0 | 201004 | 0 |
| B | 0 | 232638 | 0 |
| C | 0 | 203131 | 0 |
| D | 0 | 319551 | 0 |
| Quadrant | Total seconds | Saturated seconds | Saturation percentage |
|---|---|---|---|
| A | 96950 | 1207 | 1.244972% |
| B | 96953 | 3866 | 3.987499% |
| C | 96952 | 1839 | 1.896815% |
| D | 96961 | 14294 | 14.742010% |
Noise dominated data is calculated using 1-second bins in cleaned event files. If a bin has >2000 counts, and if more than 50% of those come from <1% of pixels, then it is considered to be noise-dominated and hence unusable.
| Quadrant | # 1 sec bins | Bins with >0 counts | Bins with >2000 counts | High rate bins dominated by noise | Noise dominated (total time) | Noise dominated (detector-on time) | Marked lightcurve |
|---|---|---|---|---|---|---|---|
| A | 129396 | 96977 | 11 | 11 | 0.01% | 0.01% | 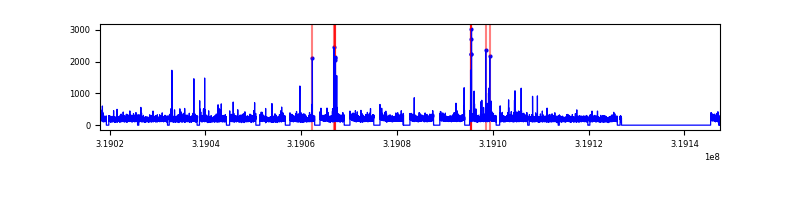 |
| B | 129392 | 96974 | 183 | 183 | 0.14% | 0.19% |  |
| C | 129418 | 96978 | 36 | 36 | 0.03% | 0.04% |  |
| D | 129394 | 96988 | 7348 | 7348 | 5.68% | 7.58% |  |
Top three noisy pixels from each quadrant. If the there are fewer than three noisy pixels in the level2.evt file, extra rows are filled as -1
| Pixel properties | Quadrant properties | ||||||
|---|---|---|---|---|---|---|---|
| Quadrant | DetID | PixID | Counts | Sigma | Mean | Median | Sigma |
| A | 12 | 96 | 270034 | 239.87 | 5119 | 5006 | 1104.9 |
| A | 13 | 254 | 144419 | 126.18 | 5119 | 5006 | 1104.9 |
| A | 0 | 226 | 32643 | 25.01 | 5119 | 5006 | 1104.9 |
| B | 3 | 64 | 5544209 | 5754.65 | 5125 | 4993 | 962.6 |
| B | 0 | 189 | 1122859 | 1161.34 | 5125 | 4993 | 962.6 |
| B | 0 | 229 | 841607 | 869.15 | 5125 | 4993 | 962.6 |
| C | 10 | 9 | 354015 | 301.8 | 4948 | 4924 | 1156.7 |
| C | 7 | 247 | 289782 | 246.27 | 4948 | 4924 | 1156.7 |
| C | 0 | 10 | 154661 | 129.45 | 4948 | 4924 | 1156.7 |
| D | 1 | 52 | 28833742 | 26127.2 | 4737 | 4564 | 1103.4 |
| D | 12 | 233 | 3965997 | 3590.15 | 4737 | 4564 | 1103.4 |
| D | 9 | 85 | 2295569 | 2076.28 | 4737 | 4564 | 1103.4 |
Histogram calculated using DETX and DETY for each event in the final _common_clean file
| Quadrant A |  |
 |
Quadrant B |
|---|---|---|---|
| Quadrant D |  |
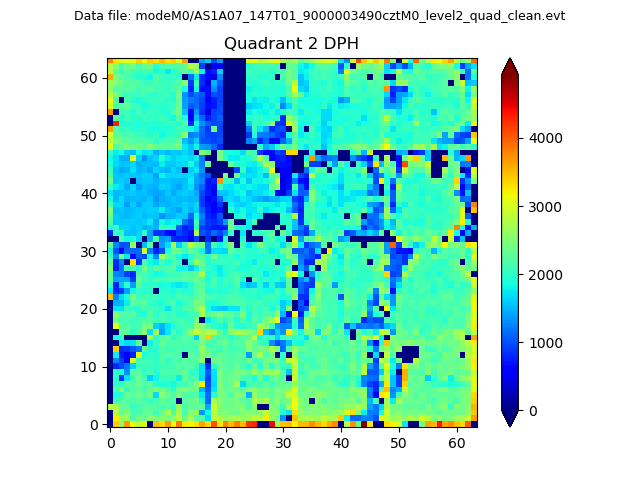 |
Quadrant C |
| Plot type | Count rate plots | Images |
|---|---|---|
| Comparison with Poisson distribution Blue bars denote a histogram of data divided into 1 sec bins. Red curve is a Poisson curve with rate = median count rate of data. |
 |
 |
| Quadrant-wise count rates Data is divided into 100 sec bins |
 |
|
| Module-wise count rates for Quadrant A Data is divided into 100 sec bins |
 |
 |
| Module-wise count rates for Quadrant B Data is divided into 100 sec bins |
 |
 |
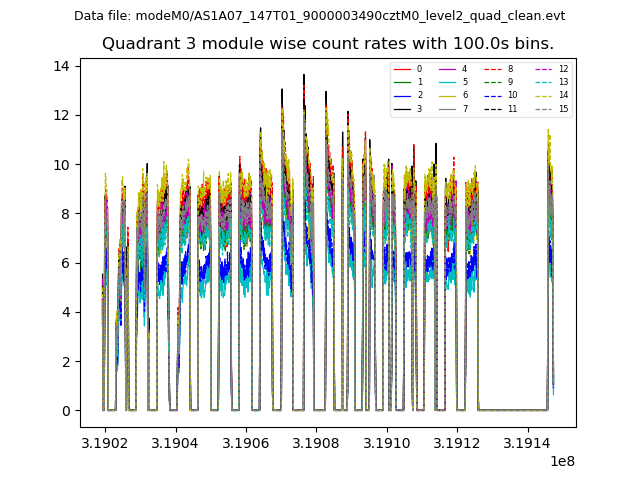
| Module-wise count rates for Quadrant C Data is divided into 100 sec bins |
 |
 |
| Module-wise count rates for Quadrant D Data is divided into 100 sec bins |
 |
 |
| Parameter | Plot |
|---|---|
| CZT HV Monitor |  |
| D_VDD | 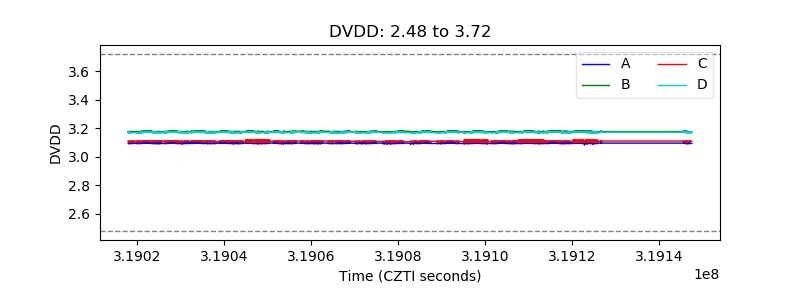 |
| Temperature 1 |  |
| Veto HV Monitor | 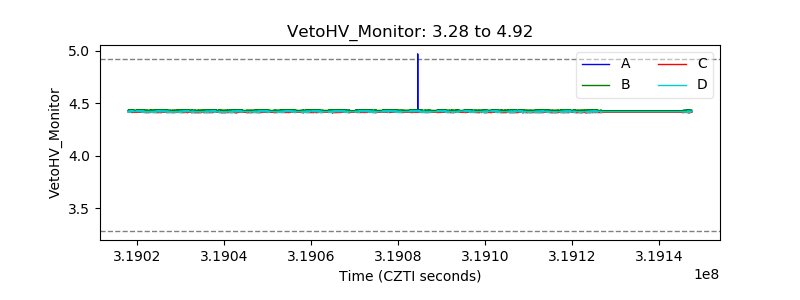 |
| Veto LLD | 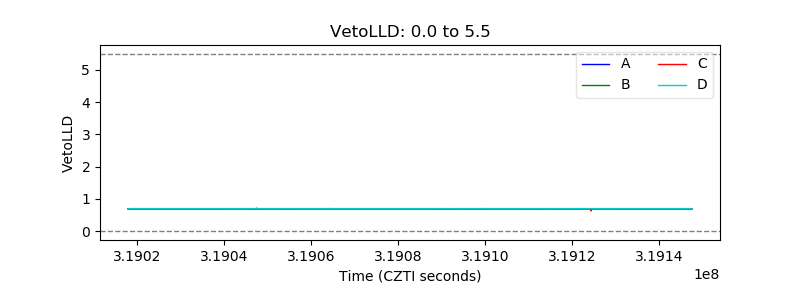 |
| Alpha Counter |  |
| _CPM_Rate |  |
| CZT Counter |  |
| +2.5 Volts monitor |  |
| +5 Volts monitor | 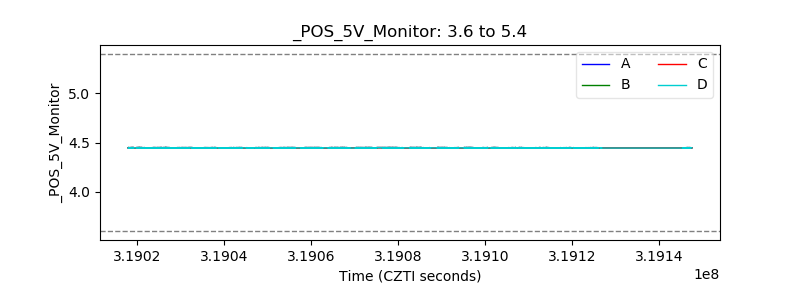 |
| _ROLL_ROT | 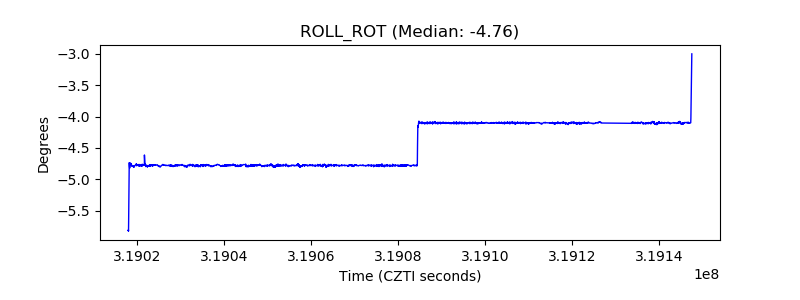 |
| _Roll_DEC |  |
| _Roll_RA | 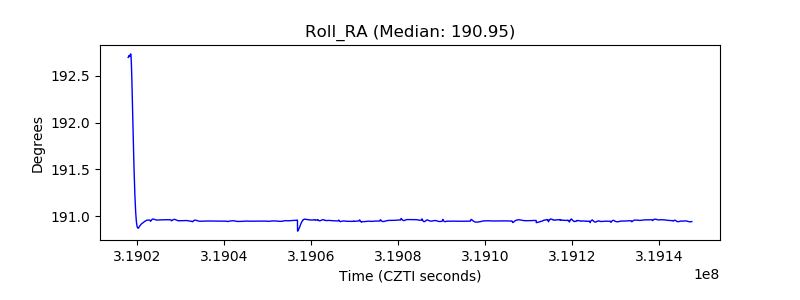 |
| Veto Counter |  |