| Param | Original file | Final file |
|---|---|---|
| Filename | modeM0/AS1A07_054T01_9000003486cztM0_level2_bc.evt | modeM0/AS1A07_054T01_9000003486cztM0_level2_quad_clean.evt |
| Size (bytes) | 2,782,540,800 | 1,428,416,640 |
| Size | 2.6 GB | 1.3 GB |
| Events in quadrant A | 15,443,608 | 9,840,321 |
| Events in quadrant B | 20,563,115 | 9,816,486 |
| Events in quadrant C | 16,779,000 | 9,354,555 |
| Events in quadrant D | 26,391,767 | 9,134,190 |
| Mode SS | |||
|---|---|---|---|
| Quadrant | BADHDUFLAG | Total packets | Discarded packets |
| A | 0 | 1528 | 0 |
| B | 0 | 1530 | 0 |
| C | 0 | 1530 | 0 |
| D | 0 | 1530 | 0 |
| Mode M9 | |||
|---|---|---|---|
| Quadrant | BADHDUFLAG | Total packets | Discarded packets |
| A | 0 | 124 | 0 |
| B | 0 | 125 | 0 |
| C | 0 | 125 | 0 |
| D | 0 | 125 | 0 |
| Mode M0 | |||
|---|---|---|---|
| Quadrant | BADHDUFLAG | Total packets | Discarded packets |
| A | 0 | 153147 | 0 |
| B | 0 | 171431 | 0 |
| C | 0 | 161081 | 0 |
| D | 0 | 186729 | 0 |
| Quadrant | Total seconds | Saturated seconds | Saturation percentage |
|---|---|---|---|
| A | 74736 | 633 | 0.846981% |
| B | 74730 | 2215 | 2.964004% |
| C | 74731 | 1790 | 2.395258% |
| D | 74721 | 1565 | 2.094458% |
Noise dominated data is calculated using 1-second bins in cleaned event files. If a bin has >2000 counts, and if more than 50% of those come from <1% of pixels, then it is considered to be noise-dominated and hence unusable.
| Quadrant | # 1 sec bins | Bins with >0 counts | Bins with >2000 counts | High rate bins dominated by noise | Noise dominated (total time) | Noise dominated (detector-on time) | Marked lightcurve |
|---|---|---|---|---|---|---|---|
| A | 91812 | 74753 | 0 | 0 | 0.00% | 0.00% |  |
| B | 91812 | 74735 | 277 | 277 | 0.30% | 0.37% |  |
| C | 91812 | 74743 | 243 | 243 | 0.26% | 0.33% |  |
| D | 91812 | 74727 | 289 | 289 | 0.31% | 0.39% |  |
Top three noisy pixels from each quadrant. If the there are fewer than three noisy pixels in the level2.evt file, extra rows are filled as -1
| Pixel properties | Quadrant properties | ||||||
|---|---|---|---|---|---|---|---|
| Quadrant | DetID | PixID | Counts | Sigma | Mean | Median | Sigma |
| A | 6 | 16 | 185703 | 212.19 | 3944 | 3874 | 856.9 |
| A | 13 | 254 | 128146 | 145.02 | 3944 | 3874 | 856.9 |
| A | 0 | 226 | 25046 | 24.71 | 3944 | 3874 | 856.9 |
| B | 3 | 64 | 3489246 | 4712.2 | 3929 | 3839 | 739.7 |
| B | 0 | 189 | 1003103 | 1350.98 | 3929 | 3839 | 739.7 |
| B | 0 | 230 | 326259 | 435.9 | 3929 | 3839 | 739.7 |
| C | 10 | 9 | 1593243 | 1794.98 | 3739 | 3724 | 885.5 |
| C | 0 | 10 | 435905 | 488.04 | 3739 | 3724 | 885.5 |
| C | 7 | 247 | 184018 | 203.6 | 3739 | 3724 | 885.5 |
| D | 1 | 52 | 5463082 | 6117.56 | 3811 | 3682 | 892.4 |
| D | 9 | 85 | 2324025 | 2600.07 | 3811 | 3682 | 892.4 |
| D | 7 | 223 | 2032077 | 2272.93 | 3811 | 3682 | 892.4 |
Histogram calculated using DETX and DETY for each event in the final _common_clean file
| Quadrant A |  |
 |
Quadrant B |
|---|---|---|---|
| Quadrant D |  |
 |
Quadrant C |
| Plot type | Count rate plots | Images |
|---|---|---|
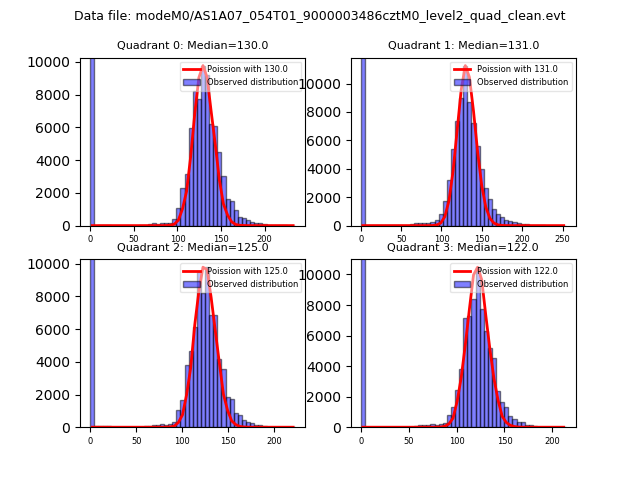
| Comparison with Poisson distribution Blue bars denote a histogram of data divided into 1 sec bins. Red curve is a Poisson curve with rate = median count rate of data. |
 |
 |
| Quadrant-wise count rates Data is divided into 100 sec bins |
 |
|
| Module-wise count rates for Quadrant A Data is divided into 100 sec bins |
 |
 |
| Module-wise count rates for Quadrant B Data is divided into 100 sec bins |
 |
 |
| Module-wise count rates for Quadrant C Data is divided into 100 sec bins |
 |
 |
| Module-wise count rates for Quadrant D Data is divided into 100 sec bins |
 |
 |
| Parameter | Plot |
|---|---|
| CZT HV Monitor |  |
| D_VDD |  |
| Temperature 1 |  |
| Veto HV Monitor |  |
| Veto LLD |  |
| Alpha Counter |  |
| _CPM_Rate |  |
| CZT Counter |  |
| +2.5 Volts monitor |  |
| +5 Volts monitor |  |
| _ROLL_ROT |  |
| _Roll_DEC |  |
| _Roll_RA |  |
| Veto Counter |  |