| Param | Original file | Final file |
|---|---|---|
| Filename | modeM0/AS1A07_024T04_9000003484cztM0_level2_bc.evt | modeM0/AS1A07_024T04_9000003484cztM0_level2_quad_clean.evt |
| Size (bytes) | 458,907,840 | 115,441,920 |
| Size | 437.6 MB | 110.1 MB |
| Events in quadrant A | 2,518,663 | 701,421 |
| Events in quadrant B | 2,952,288 | 704,348 |
| Events in quadrant C | 2,336,560 | 686,395 |
| Events in quadrant D | 5,361,078 | 669,138 |
| Mode M0 | |||
|---|---|---|---|
| Quadrant | BADHDUFLAG | Total packets | Discarded packets |
| A | 0 | 23037 | 0 |
| B | 0 | 24760 | 0 |
| C | 0 | 22746 | 0 |
| D | 0 | 32657 | 0 |
| Mode M9 | |||
|---|---|---|---|
| Quadrant | BADHDUFLAG | Total packets | Discarded packets |
| A | 0 | 9 | 0 |
| B | 0 | 9 | 0 |
| C | 0 | 9 | 0 |
| D | 0 | 9 | 0 |
| Mode SS | |||
|---|---|---|---|
| Quadrant | BADHDUFLAG | Total packets | Discarded packets |
| A | 0 | 218 | 0 |
| B | 0 | 218 | 0 |
| C | 0 | 218 | 0 |
| D | 0 | 218 | 0 |
| Quadrant | Total seconds | Saturated seconds | Saturation percentage |
|---|---|---|---|
| A | 10604 | 87 | 0.820445% |
| B | 10602 | 285 | 2.688172% |
| C | 10604 | 144 | 1.357978% |
| D | 10603 | 794 | 7.488447% |
Noise dominated data is calculated using 1-second bins in cleaned event files. If a bin has >2000 counts, and if more than 50% of those come from <1% of pixels, then it is considered to be noise-dominated and hence unusable.
| Quadrant | # 1 sec bins | Bins with >0 counts | Bins with >2000 counts | High rate bins dominated by noise | Noise dominated (total time) | Noise dominated (detector-on time) | Marked lightcurve |
|---|---|---|---|---|---|---|---|
| A | 11579 | 10603 | 2 | 2 | 0.02% | 0.02% |  |
| B | 11579 | 10602 | 29 | 29 | 0.25% | 0.27% | 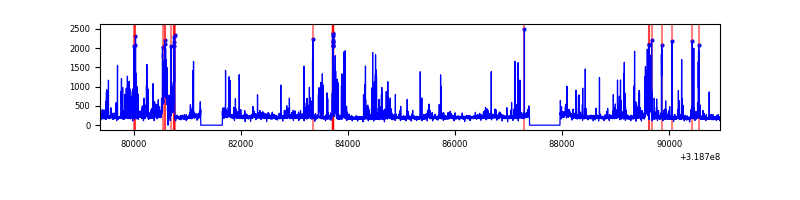 |
| C | 11579 | 10602 | 0 | 0 | 0.00% | 0.00% |  |
| D | 11579 | 10602 | 41 | 41 | 0.35% | 0.39% |  |
Top three noisy pixels from each quadrant. If the there are fewer than three noisy pixels in the level2.evt file, extra rows are filled as -1
| Pixel properties | Quadrant properties | ||||||
|---|---|---|---|---|---|---|---|
| Quadrant | DetID | PixID | Counts | Sigma | Mean | Median | Sigma |
| A | 15 | 174 | 358434 | 2976.99 | 533 | 521 | 120.2 |
| A | 6 | 16 | 95663 | 791.36 | 533 | 521 | 120.2 |
| A | 13 | 254 | 17168 | 138.46 | 533 | 521 | 120.2 |
| B | 3 | 64 | 706736 | 6730.21 | 532 | 516 | 104.9 |
| B | 0 | 189 | 73337 | 693.98 | 532 | 516 | 104.9 |
| B | 0 | 245 | 39474 | 371.27 | 532 | 516 | 104.9 |
| C | 10 | 9 | 302305 | 2463.18 | 514 | 509 | 122.5 |
| C | 7 | 247 | 43805 | 353.37 | 514 | 509 | 122.5 |
| C | 3 | 233 | 5173 | 38.07 | 514 | 509 | 122.5 |
| D | 7 | 223 | 1521855 | 12414.74 | 514 | 493 | 122.5 |
| D | 1 | 52 | 1062371 | 8665.22 | 514 | 493 | 122.5 |
| D | 9 | 85 | 211504 | 1721.91 | 514 | 493 | 122.5 |
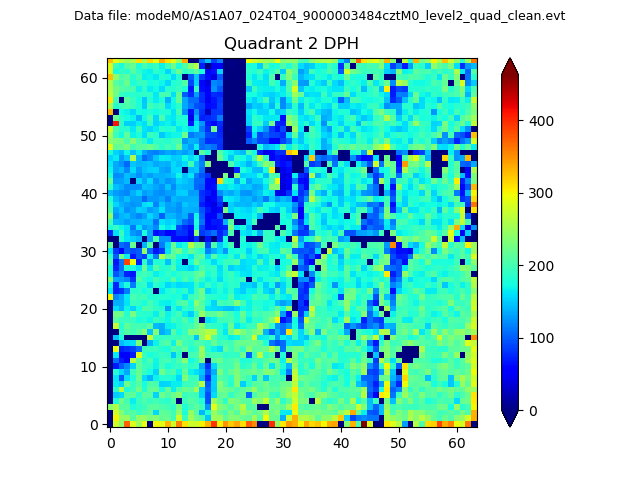
Histogram calculated using DETX and DETY for each event in the final _common_clean file
| Quadrant A |  |
 |
Quadrant B |
|---|---|---|---|
| Quadrant D | 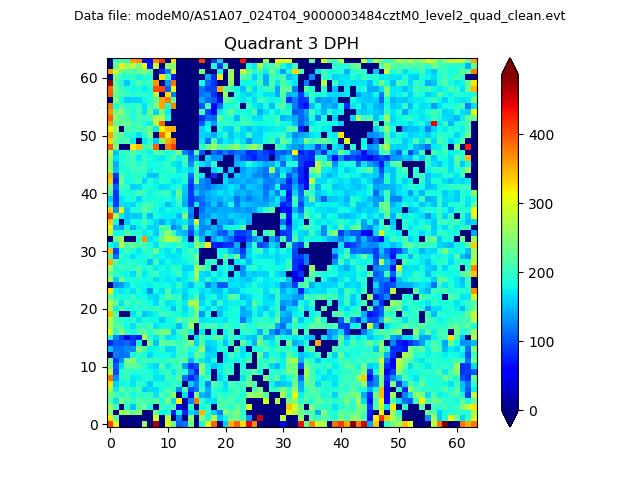 |
 |
Quadrant C |
| Plot type | Count rate plots | Images |
|---|---|---|
| Comparison with Poisson distribution Blue bars denote a histogram of data divided into 1 sec bins. Red curve is a Poisson curve with rate = median count rate of data. |
 |
 |
| Quadrant-wise count rates Data is divided into 100 sec bins |
 |
|
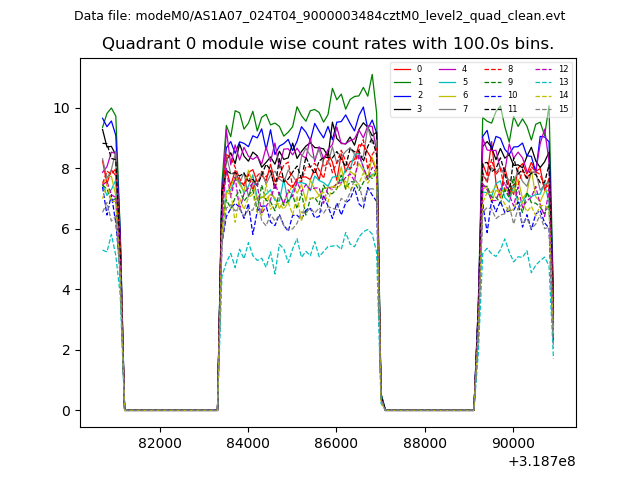
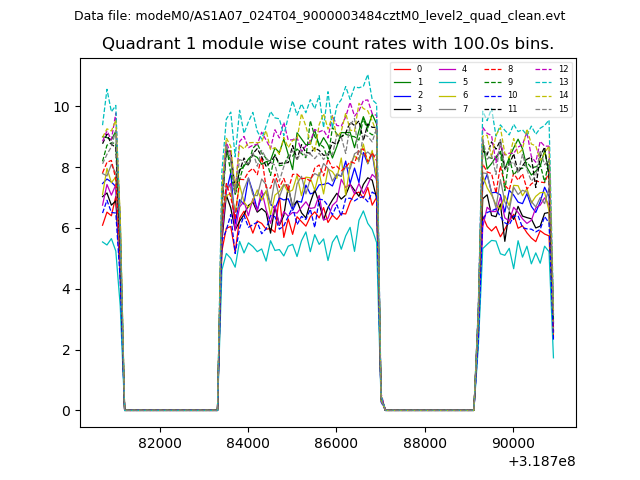
| Module-wise count rates for Quadrant A Data is divided into 100 sec bins |
 |
 |
| Module-wise count rates for Quadrant B Data is divided into 100 sec bins |
 |
 |
| Module-wise count rates for Quadrant C Data is divided into 100 sec bins |
 |
 |
| Module-wise count rates for Quadrant D Data is divided into 100 sec bins |
 |
 |
| Parameter | Plot |
|---|---|
| CZT HV Monitor |  |
| D_VDD |  |
| Temperature 1 | 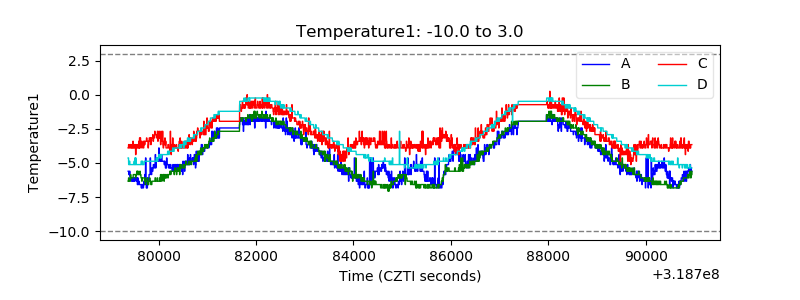 |
| Veto HV Monitor |  |
| Veto LLD |  |
| Alpha Counter |  |
| _CPM_Rate | 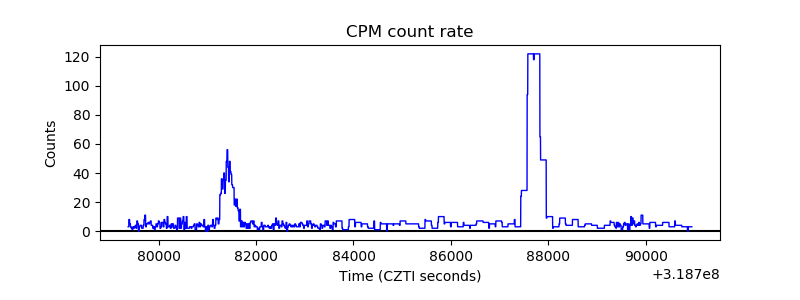 |
| CZT Counter |  |
| +2.5 Volts monitor |  |
| +5 Volts monitor |  |
| _ROLL_ROT |  |
| _Roll_DEC |  |
| _Roll_RA | 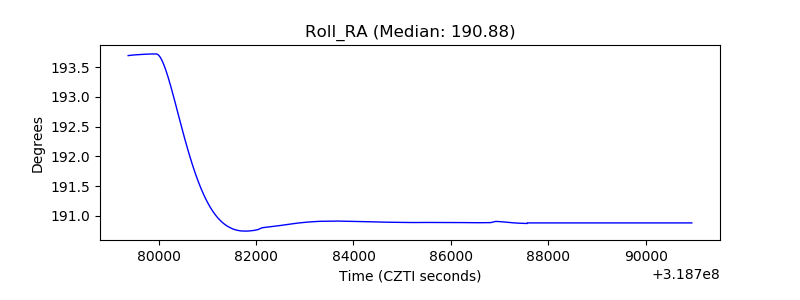 |
| Veto Counter | 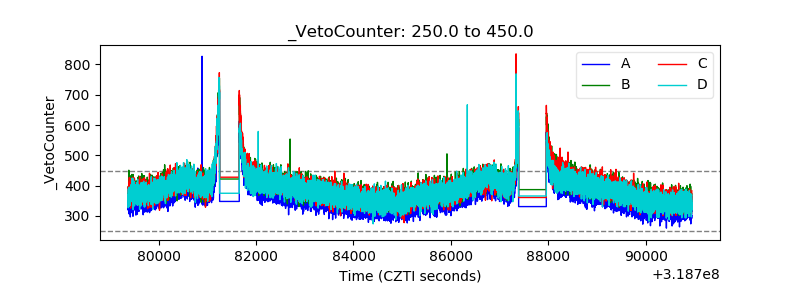 |