| Param | Original file | Final file |
|---|---|---|
| Filename | modeM0/AS1A07_112T02_9000003480cztM0_level2_bc.evt | modeM0/AS1A07_112T02_9000003480cztM0_level2_quad_clean.evt |
| Size (bytes) | 1,843,378,560 | 735,445,440 |
| Size | 1.7 GB | 701.4 MB |
| Events in quadrant A | 11,391,339 | 4,721,759 |
| Events in quadrant B | 12,485,267 | 4,787,483 |
| Events in quadrant C | 11,895,995 | 4,582,990 |
| Events in quadrant D | 16,370,549 | 4,478,851 |
| Mode M9 | |||
|---|---|---|---|
| Quadrant | BADHDUFLAG | Total packets | Discarded packets |
| A | 0 | 93 | 0 |
| B | 0 | 93 | 0 |
| C | 0 | 93 | 0 |
| D | 0 | 93 | 0 |
| Mode SS | |||
|---|---|---|---|
| Quadrant | BADHDUFLAG | Total packets | Discarded packets |
| A | 0 | 1102 | 0 |
| B | 0 | 1102 | 0 |
| C | 0 | 1102 | 0 |
| D | 0 | 1102 | 0 |
| Mode M0 | |||
|---|---|---|---|
| Quadrant | BADHDUFLAG | Total packets | Discarded packets |
| A | 0 | 110930 | 0 |
| B | 0 | 115028 | 0 |
| C | 0 | 113907 | 0 |
| D | 0 | 126944 | 0 |
| Quadrant | Total seconds | Saturated seconds | Saturation percentage |
|---|---|---|---|
| A | 54010 | 301 | 0.557304% |
| B | 54011 | 570 | 1.055341% |
| C | 54014 | 714 | 1.321880% |
| D | 54012 | 1133 | 2.097682% |
Noise dominated data is calculated using 1-second bins in cleaned event files. If a bin has >2000 counts, and if more than 50% of those come from <1% of pixels, then it is considered to be noise-dominated and hence unusable.
| Quadrant | # 1 sec bins | Bins with >0 counts | Bins with >2000 counts | High rate bins dominated by noise | Noise dominated (total time) | Noise dominated (detector-on time) | Marked lightcurve |
|---|---|---|---|---|---|---|---|
| A | 63459 | 54010 | 0 | 0 | 0.00% | 0.00% |  |
| B | 63459 | 54010 | 3 | 3 | 0.00% | 0.01% |  |
| C | 63459 | 54013 | 21 | 21 | 0.03% | 0.04% |  |
| D | 63459 | 54015 | 302 | 302 | 0.48% | 0.56% |  |
Top three noisy pixels from each quadrant. If the there are fewer than three noisy pixels in the level2.evt file, extra rows are filled as -1
| Pixel properties | Quadrant properties | ||||||
|---|---|---|---|---|---|---|---|
| Quadrant | DetID | PixID | Counts | Sigma | Mean | Median | Sigma |
| A | 13 | 254 | 82683 | 125.32 | 2939 | 2895 | 636.7 |
| A | 4 | 2 | 32757 | 46.9 | 2939 | 2895 | 636.7 |
| A | 0 | 226 | 18902 | 25.14 | 2939 | 2895 | 636.7 |
| B | 0 | 189 | 521832 | 936.0 | 2947 | 2879 | 554.4 |
| B | 0 | 229 | 169753 | 300.98 | 2947 | 2879 | 554.4 |
| B | 0 | 230 | 133148 | 234.96 | 2947 | 2879 | 554.4 |
| C | 2 | 16 | 420910 | 629.95 | 2806 | 2794 | 663.7 |
| C | 7 | 247 | 347881 | 519.92 | 2806 | 2794 | 663.7 |
| C | 10 | 91 | 196433 | 291.74 | 2806 | 2794 | 663.7 |
| D | 1 | 52 | 4161778 | 6202.55 | 2870 | 2773 | 670.5 |
| D | 9 | 85 | 573180 | 850.68 | 2870 | 2773 | 670.5 |
| D | 2 | 234 | 224615 | 330.85 | 2870 | 2773 | 670.5 |
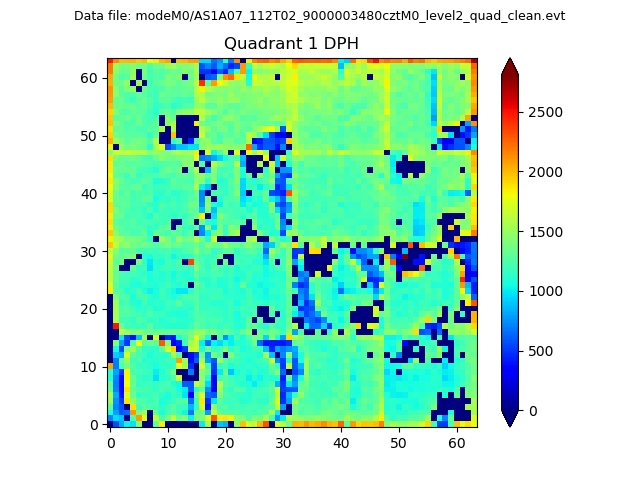
Histogram calculated using DETX and DETY for each event in the final _common_clean file
| Quadrant A |  |
 |
Quadrant B |
|---|---|---|---|
| Quadrant D |  |
 |
Quadrant C |
| Plot type | Count rate plots | Images |
|---|---|---|
| Comparison with Poisson distribution Blue bars denote a histogram of data divided into 1 sec bins. Red curve is a Poisson curve with rate = median count rate of data. |
 |
 |
| Quadrant-wise count rates Data is divided into 100 sec bins |
 |
|
| Module-wise count rates for Quadrant A Data is divided into 100 sec bins |
 |
 |
| Module-wise count rates for Quadrant B Data is divided into 100 sec bins |
 |
 |
| Module-wise count rates for Quadrant C Data is divided into 100 sec bins |
 |
 |
| Module-wise count rates for Quadrant D Data is divided into 100 sec bins |
 |
 |
| Parameter | Plot |
|---|---|
| CZT HV Monitor |  |
| D_VDD |  |
| Temperature 1 | 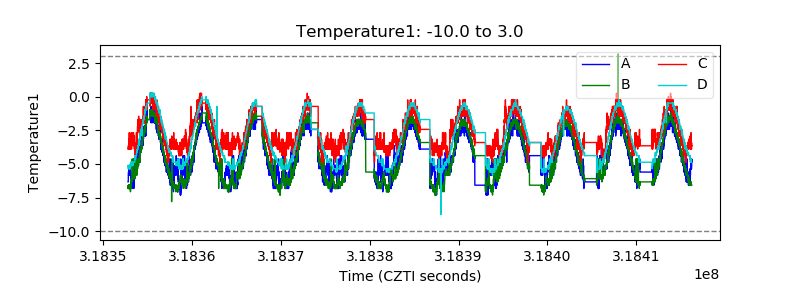 |
| Veto HV Monitor |  |
| Veto LLD |  |
| Alpha Counter |  |
| _CPM_Rate |  |
| CZT Counter |  |
| +2.5 Volts monitor |  |
| +5 Volts monitor |  |
| _ROLL_ROT |  |
| _Roll_DEC |  |
| _Roll_RA |  |
| Veto Counter | 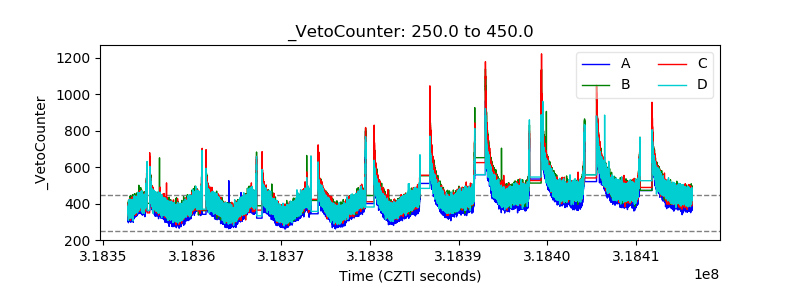 |