| Param | Original file | Final file |
|---|---|---|
| Filename | modeM0/AS1A07_112T01_9000003478cztM0_level2_bc.evt | modeM0/AS1A07_112T01_9000003478cztM0_level2_quad_clean.evt |
| Size (bytes) | 721,756,800 | 259,093,440 |
| Size | 688.3 MB | 247.1 MB |
| Events in quadrant A | 4,324,183 | 1,639,323 |
| Events in quadrant B | 5,090,482 | 1,679,318 |
| Events in quadrant C | 4,189,139 | 1,603,636 |
| Events in quadrant D | 6,894,138 | 1,556,100 |
| Mode SS | |||
|---|---|---|---|
| Quadrant | BADHDUFLAG | Total packets | Discarded packets |
| A | 0 | 406 | 0 |
| B | 0 | 406 | 0 |
| C | 0 | 406 | 0 |
| D | 0 | 406 | 0 |
| Mode M0 | |||
|---|---|---|---|
| Quadrant | BADHDUFLAG | Total packets | Discarded packets |
| A | 0 | 41347 | 0 |
| B | 0 | 44763 | 0 |
| C | 0 | 41310 | 0 |
| D | 0 | 49862 | 0 |
| Mode M9 | |||
|---|---|---|---|
| Quadrant | BADHDUFLAG | Total packets | Discarded packets |
| A | 0 | 87 | 0 |
| B | 0 | 87 | 0 |
| C | 0 | 87 | 0 |
| D | 0 | 87 | 0 |
| Quadrant | Total seconds | Saturated seconds | Saturation percentage |
|---|---|---|---|
| A | 19881 | 78 | 0.392334% |
| B | 19876 | 312 | 1.569732% |
| C | 19880 | 195 | 0.980885% |
| D | 19881 | 468 | 2.354006% |
Noise dominated data is calculated using 1-second bins in cleaned event files. If a bin has >2000 counts, and if more than 50% of those come from <1% of pixels, then it is considered to be noise-dominated and hence unusable.
| Quadrant | # 1 sec bins | Bins with >0 counts | Bins with >2000 counts | High rate bins dominated by noise | Noise dominated (total time) | Noise dominated (detector-on time) | Marked lightcurve |
|---|---|---|---|---|---|---|---|
| A | 24076 | 19822 | 0 | 0 | 0.00% | 0.00% |  |
| B | 24076 | 19819 | 2 | 2 | 0.01% | 0.01% |  |
| C | 24076 | 19817 | 1 | 1 | 0.00% | 0.01% |  |
| D | 24076 | 19826 | 138 | 138 | 0.57% | 0.70% | 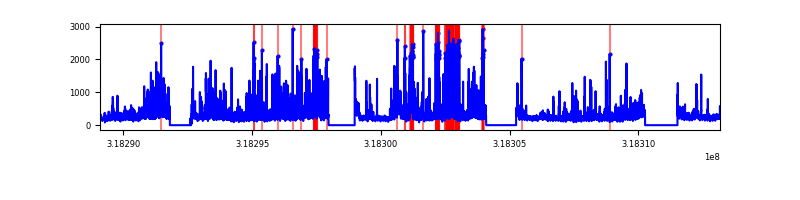 |
Top three noisy pixels from each quadrant. If the there are fewer than three noisy pixels in the level2.evt file, extra rows are filled as -1
| Pixel properties | Quadrant properties | ||||||
|---|---|---|---|---|---|---|---|
| Quadrant | DetID | PixID | Counts | Sigma | Mean | Median | Sigma |
| A | 2 | 79 | 127202 | 535.9 | 1087 | 1070 | 235.4 |
| A | 13 | 254 | 32498 | 133.53 | 1087 | 1070 | 235.4 |
| A | 0 | 226 | 6952 | 24.99 | 1087 | 1070 | 235.4 |
| B | 0 | 189 | 329319 | 1615.34 | 1089 | 1066 | 203.2 |
| B | 0 | 219 | 237425 | 1163.12 | 1089 | 1066 | 203.2 |
| B | 12 | 17 | 172966 | 845.92 | 1089 | 1066 | 203.2 |
| C | 7 | 247 | 109415 | 442.48 | 1043 | 1038 | 244.9 |
| C | 2 | 16 | 15418 | 58.71 | 1043 | 1038 | 244.9 |
| C | 10 | 9 | 12222 | 45.66 | 1043 | 1038 | 244.9 |
| D | 1 | 52 | 2136331 | 8721.52 | 1056 | 1020 | 244.8 |
| D | 9 | 35 | 348267 | 1418.3 | 1056 | 1020 | 244.8 |
| D | 9 | 85 | 150008 | 608.53 | 1056 | 1020 | 244.8 |
Histogram calculated using DETX and DETY for each event in the final _common_clean file
| Quadrant A |  |
 |
Quadrant B |
|---|---|---|---|
| Quadrant D | 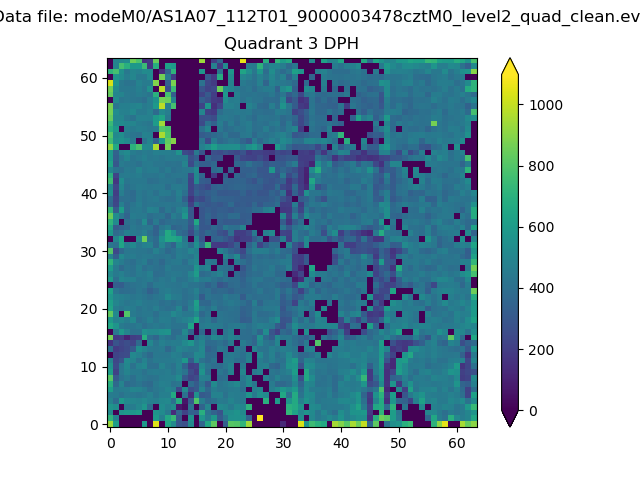 |
 |
Quadrant C |
| Plot type | Count rate plots | Images |
|---|---|---|
| Comparison with Poisson distribution Blue bars denote a histogram of data divided into 1 sec bins. Red curve is a Poisson curve with rate = median count rate of data. |
 |
 |
| Quadrant-wise count rates Data is divided into 100 sec bins |
 |
|
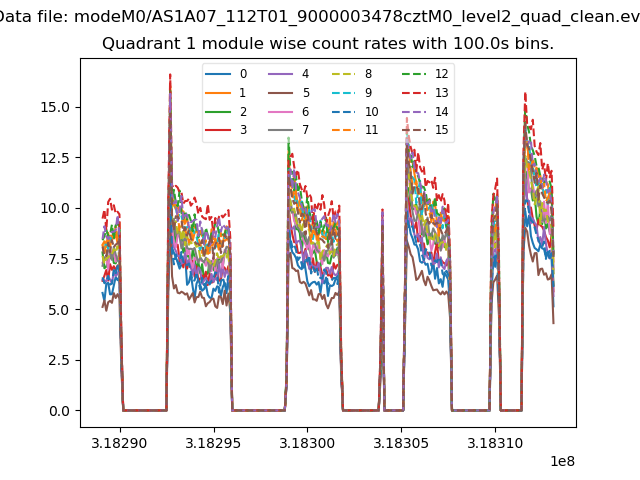
| Module-wise count rates for Quadrant A Data is divided into 100 sec bins |
 |
 |
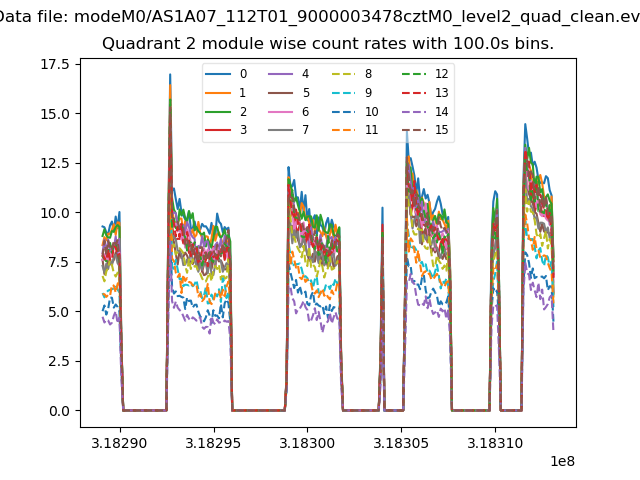
| Module-wise count rates for Quadrant B Data is divided into 100 sec bins |
 |
 |
| Module-wise count rates for Quadrant C Data is divided into 100 sec bins |
 |
 |
| Module-wise count rates for Quadrant D Data is divided into 100 sec bins |
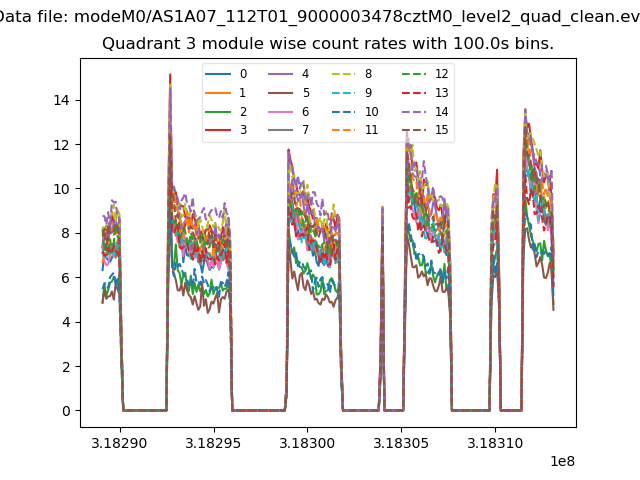 |
 |
| Parameter | Plot |
|---|---|
| CZT HV Monitor | 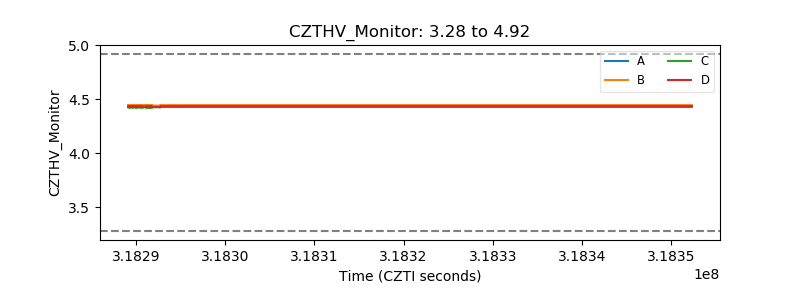 |
| D_VDD |  |
| Temperature 1 |  |
| Veto HV Monitor |  |
| Veto LLD |  |
| Alpha Counter |  |
| _CPM_Rate |  |
| CZT Counter |  |
| +2.5 Volts monitor |  |
| +5 Volts monitor |  |
| _ROLL_ROT | 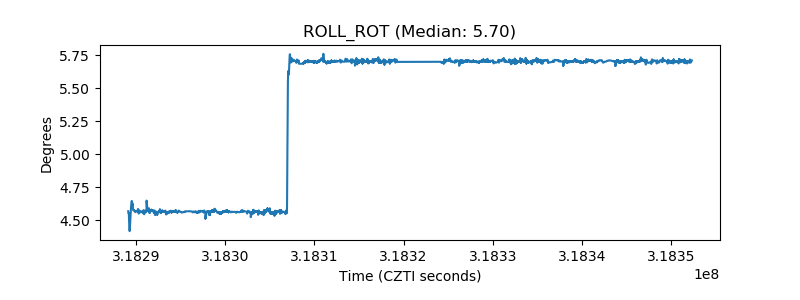 |
| _Roll_DEC |  |
| _Roll_RA |  |
| Veto Counter | 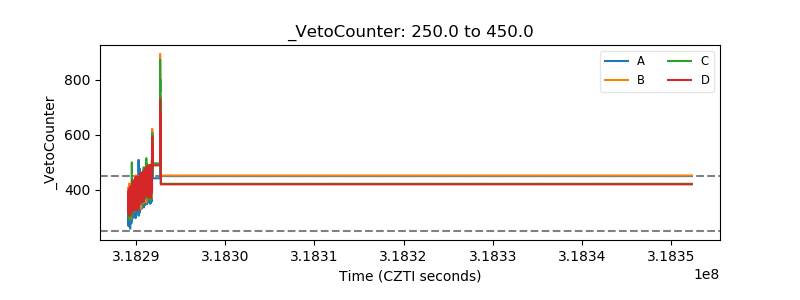 |