| Param | Original file | Final file |
|---|---|---|
| Filename | modeM0/AS1A07_100T02_9000003476cztM0_level2_bc.evt | modeM0/AS1A07_100T02_9000003476cztM0_level2_quad_clean.evt |
| Size (bytes) | 1,460,021,760 | 555,523,200 |
| Size | 1.4 GB | 529.8 MB |
| Events in quadrant A | 7,539,340 | 3,668,347 |
| Events in quadrant B | 9,036,222 | 3,727,659 |
| Events in quadrant C | 10,041,804 | 3,550,781 |
| Events in quadrant D | 15,132,471 | 3,397,582 |
| Mode SS | |||
|---|---|---|---|
| Quadrant | BADHDUFLAG | Total packets | Discarded packets |
| A | 0 | 732 | 0 |
| B | 0 | 732 | 0 |
| C | 0 | 736 | 0 |
| D | 0 | 726 | 0 |
| Mode M9 | |||
|---|---|---|---|
| Quadrant | BADHDUFLAG | Total packets | Discarded packets |
| A | 0 | 66 | 0 |
| B | 0 | 67 | 0 |
| C | 0 | 66 | 0 |
| D | 0 | 66 | 0 |
| Mode M0 | |||
|---|---|---|---|
| Quadrant | BADHDUFLAG | Total packets | Discarded packets |
| A | 0 | 74192 | 0 |
| B | 0 | 80639 | 0 |
| C | 0 | 85088 | 0 |
| D | 0 | 101130 | 0 |
| Quadrant | Total seconds | Saturated seconds | Saturation percentage |
|---|---|---|---|
| A | 36158 | 215 | 0.594613% |
| B | 36161 | 502 | 1.388236% |
| C | 36167 | 1296 | 3.583377% |
| D | 36125 | 2483 | 6.873356% |
Noise dominated data is calculated using 1-second bins in cleaned event files. If a bin has >2000 counts, and if more than 50% of those come from <1% of pixels, then it is considered to be noise-dominated and hence unusable.
| Quadrant | # 1 sec bins | Bins with >0 counts | Bins with >2000 counts | High rate bins dominated by noise | Noise dominated (total time) | Noise dominated (detector-on time) | Marked lightcurve |
|---|---|---|---|---|---|---|---|
| A | 42153 | 35756 | 4 | 4 | 0.01% | 0.01% |  |
| B | 42153 | 35748 | 15 | 15 | 0.04% | 0.04% |  |
| C | 42153 | 35761 | 57 | 57 | 0.14% | 0.16% |  |
| D | 42153 | 35760 | 644 | 644 | 1.53% | 1.80% |  |
Top three noisy pixels from each quadrant. If the there are fewer than three noisy pixels in the level2.evt file, extra rows are filled as -1
| Pixel properties | Quadrant properties | ||||||
|---|---|---|---|---|---|---|---|
| Quadrant | DetID | PixID | Counts | Sigma | Mean | Median | Sigma |
| A | 13 | 254 | 59636 | 137.3 | 1938 | 1902 | 420.5 |
| A | 10 | 253 | 23205 | 50.66 | 1938 | 1902 | 420.5 |
| A | 4 | 2 | 14675 | 30.37 | 1938 | 1902 | 420.5 |
| B | 0 | 189 | 785088 | 2120.79 | 1960 | 1915 | 369.3 |
| B | 0 | 229 | 248844 | 668.67 | 1960 | 1915 | 369.3 |
| B | 0 | 230 | 130989 | 349.52 | 1960 | 1915 | 369.3 |
| C | 2 | 16 | 2297975 | 5161.61 | 1872 | 1867 | 444.8 |
| C | 8 | 208 | 253701 | 566.12 | 1872 | 1867 | 444.8 |
| C | 7 | 247 | 193533 | 430.86 | 1872 | 1867 | 444.8 |
| D | 1 | 52 | 6005914 | 13796.99 | 1872 | 1813 | 435.2 |
| D | 9 | 35 | 864105 | 1981.48 | 1872 | 1813 | 435.2 |
| D | 13 | 104 | 252624 | 576.35 | 1872 | 1813 | 435.2 |
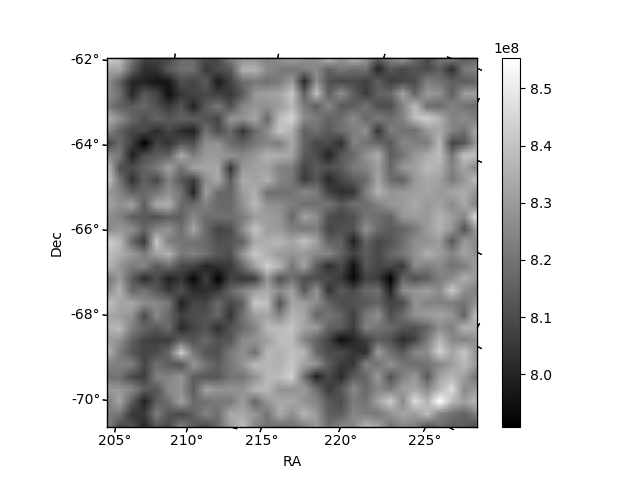
Histogram calculated using DETX and DETY for each event in the final _common_clean file
| Quadrant A |  |
 |
Quadrant B |
|---|---|---|---|
| Quadrant D |  |
 |
Quadrant C |
| Plot type | Count rate plots | Images |
|---|---|---|
| Comparison with Poisson distribution Blue bars denote a histogram of data divided into 1 sec bins. Red curve is a Poisson curve with rate = median count rate of data. |
 |
 |
| Quadrant-wise count rates Data is divided into 100 sec bins |
 |
|
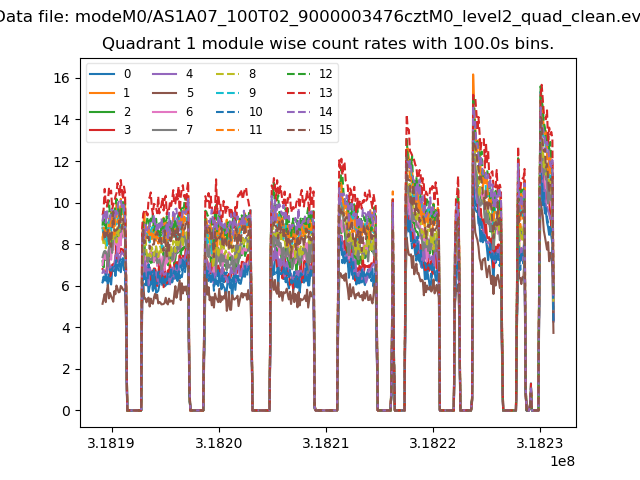
| Module-wise count rates for Quadrant A Data is divided into 100 sec bins |
 |
 |
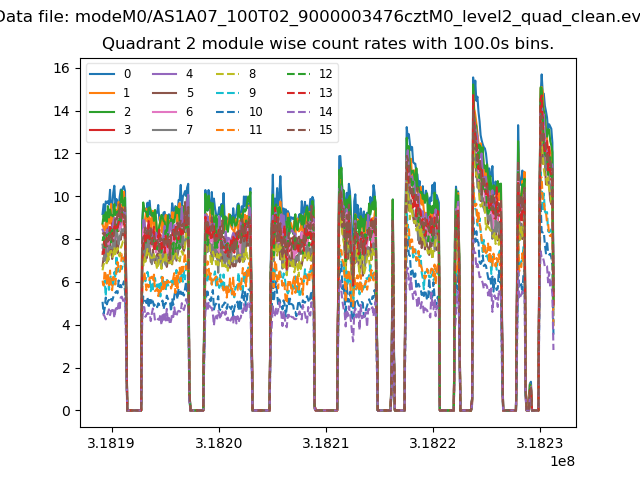
| Module-wise count rates for Quadrant B Data is divided into 100 sec bins |
 |
 |
| Module-wise count rates for Quadrant C Data is divided into 100 sec bins |
 |
 |
| Module-wise count rates for Quadrant D Data is divided into 100 sec bins |
 |
 |
| Parameter | Plot |
|---|---|
| CZT HV Monitor |  |
| D_VDD |  |
| Temperature 1 |  |
| Veto HV Monitor | 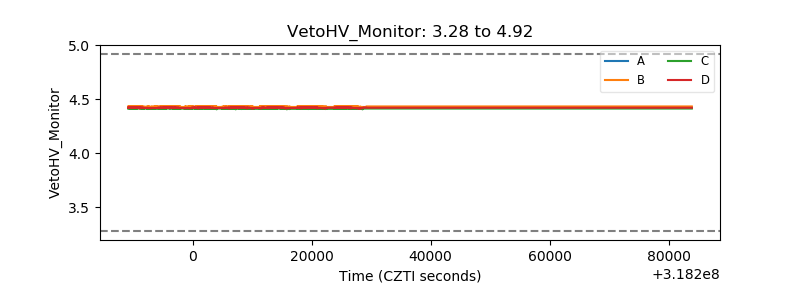 |
| Veto LLD | 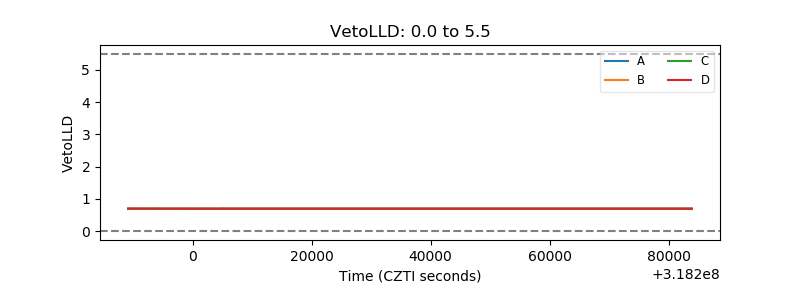 |
| Alpha Counter |  |
| _CPM_Rate |  |
| CZT Counter |  |
| +2.5 Volts monitor | 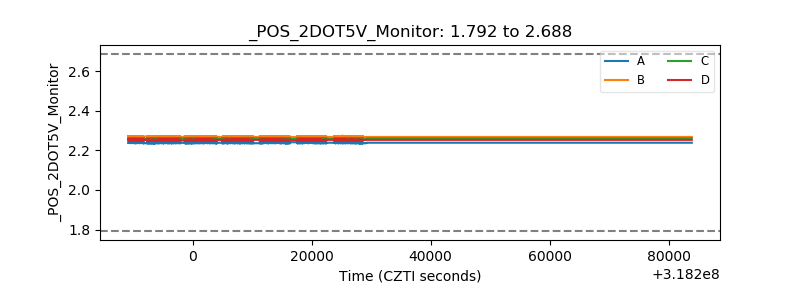 |
| +5 Volts monitor | 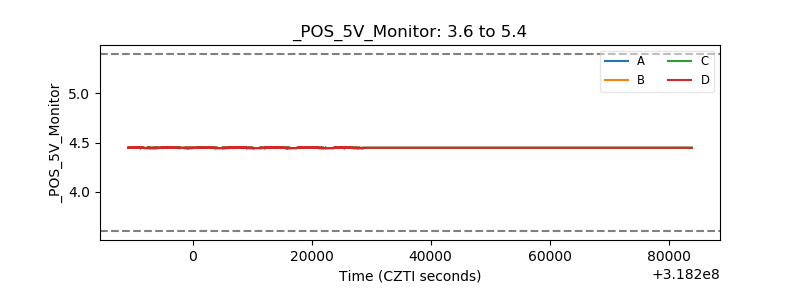 |
| _ROLL_ROT | 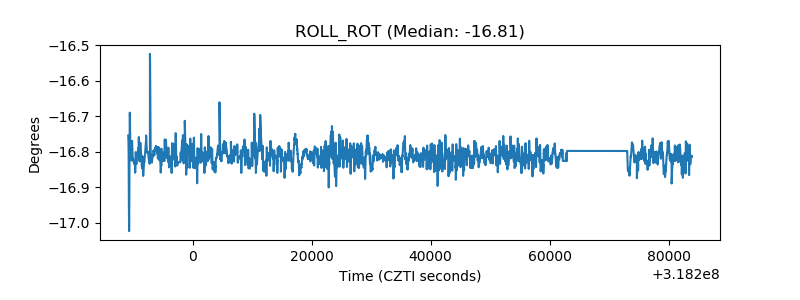 |
| _Roll_DEC |  |
| _Roll_RA |  |
| Veto Counter |  |