| Param | Original file | Final file |
|---|---|---|
| Filename | modeM0/AS1C05_002T05_9000003472cztM0_level2_bc.evt | modeM0/AS1C05_002T05_9000003472cztM0_level2_quad_clean.evt |
| Size (bytes) | 171,089,280 | 69,986,880 |
| Size | 163.2 MB | 66.7 MB |
| Events in quadrant A | 998,275 | 450,272 |
| Events in quadrant B | 1,049,251 | 453,332 |
| Events in quadrant C | 989,133 | 438,249 |
| Events in quadrant D | 1,803,643 | 434,281 |
| Mode SS | |||
|---|---|---|---|
| Quadrant | BADHDUFLAG | Total packets | Discarded packets |
| A | 0 | 100 | 0 |
| B | 0 | 100 | 0 |
| C | 0 | 100 | 0 |
| D | 0 | 100 | 0 |
| Mode M9 | |||
|---|---|---|---|
| Quadrant | BADHDUFLAG | Total packets | Discarded packets |
| A | 0 | 4 | 0 |
| B | 0 | 4 | 0 |
| C | 0 | 4 | 0 |
| D | 0 | 4 | 0 |
| Mode M0 | |||
|---|---|---|---|
| Quadrant | BADHDUFLAG | Total packets | Discarded packets |
| A | 0 | 10016 | 0 |
| B | 0 | 10085 | 0 |
| C | 0 | 10028 | 0 |
| D | 0 | 12710 | 0 |
| Quadrant | Total seconds | Saturated seconds | Saturation percentage |
|---|---|---|---|
| A | 4890 | 89 | 1.820041% |
| B | 4890 | 107 | 2.188139% |
| C | 4890 | 103 | 2.106339% |
| D | 4890 | 136 | 2.781186% |
Noise dominated data is calculated using 1-second bins in cleaned event files. If a bin has >2000 counts, and if more than 50% of those come from <1% of pixels, then it is considered to be noise-dominated and hence unusable.
| Quadrant | # 1 sec bins | Bins with >0 counts | Bins with >2000 counts | High rate bins dominated by noise | Noise dominated (total time) | Noise dominated (detector-on time) | Marked lightcurve |
|---|---|---|---|---|---|---|---|
| A | 4889 | 4889 | 0 | 0 | 0.00% | 0.00% | 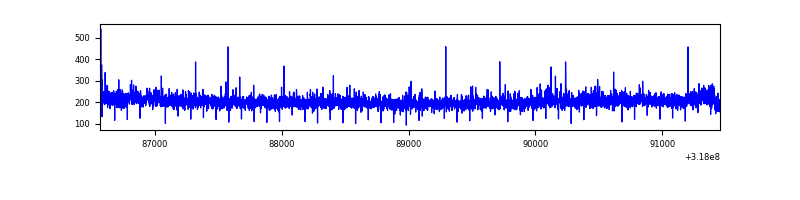 |
| B | 4889 | 4889 | 0 | 0 | 0.00% | 0.00% | 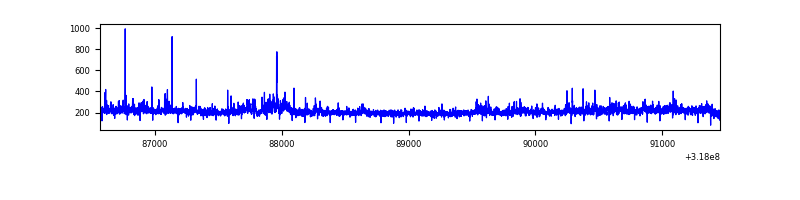 |
| C | 4889 | 4889 | 0 | 0 | 0.00% | 0.00% |  |
| D | 4889 | 4889 | 15 | 15 | 0.31% | 0.31% | 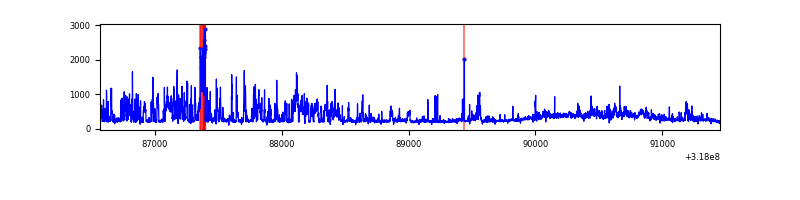 |
Top three noisy pixels from each quadrant. If the there are fewer than three noisy pixels in the level2.evt file, extra rows are filled as -1
| Pixel properties | Quadrant properties | ||||||
|---|---|---|---|---|---|---|---|
| Quadrant | DetID | PixID | Counts | Sigma | Mean | Median | Sigma |
| A | 13 | 254 | 8964 | 148.68 | 256 | 250 | 58.6 |
| A | 15 | 174 | 2666 | 41.22 | 256 | 250 | 58.6 |
| A | 4 | 2 | 2534 | 38.97 | 256 | 250 | 58.6 |
| B | 0 | 219 | 19551 | 377.07 | 255 | 249 | 51.2 |
| B | 0 | 229 | 17743 | 341.75 | 255 | 249 | 51.2 |
| B | 0 | 190 | 14802 | 284.3 | 255 | 249 | 51.2 |
| C | 1 | 16 | 14244 | 234.72 | 245 | 243 | 59.6 |
| C | 7 | 247 | 13265 | 218.31 | 245 | 243 | 59.6 |
| C | 3 | 233 | 10759 | 176.3 | 245 | 243 | 59.6 |
| D | 7 | 238 | 535060 | 8716.92 | 252 | 243 | 61.4 |
| D | 1 | 52 | 154405 | 2512.67 | 252 | 243 | 61.4 |
| D | 14 | 50 | 63882 | 1037.24 | 252 | 243 | 61.4 |
Histogram calculated using DETX and DETY for each event in the final _common_clean file
| Quadrant A | 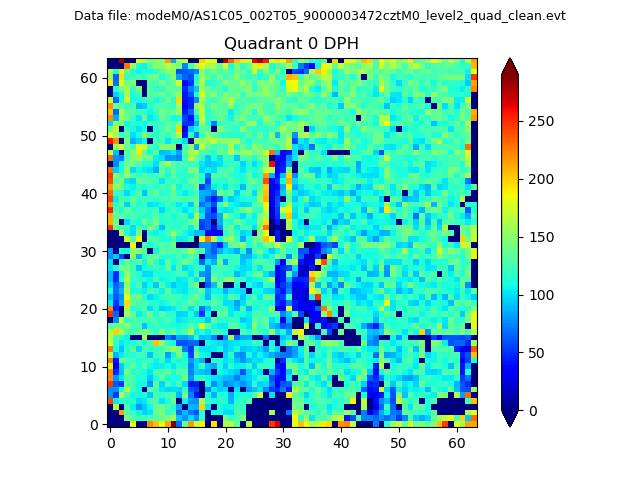 |
 |
Quadrant B |
|---|---|---|---|
| Quadrant D |  |
 |
Quadrant C |
| Plot type | Count rate plots | Images |
|---|---|---|
| Comparison with Poisson distribution Blue bars denote a histogram of data divided into 1 sec bins. Red curve is a Poisson curve with rate = median count rate of data. |
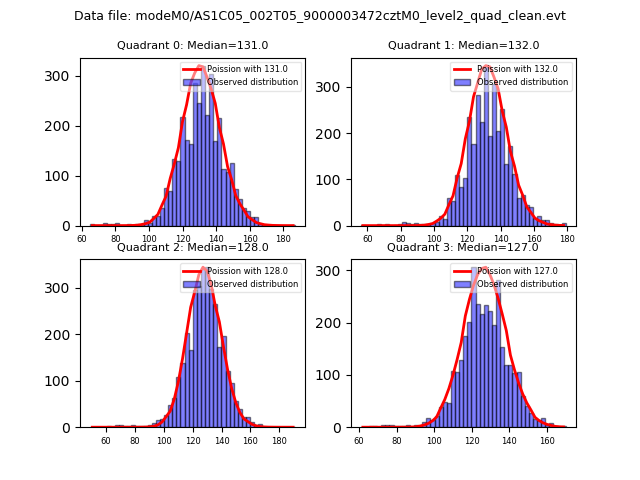 |
 |
| Quadrant-wise count rates Data is divided into 100 sec bins |
 |
|
| Module-wise count rates for Quadrant A Data is divided into 100 sec bins |
 |
 |
| Module-wise count rates for Quadrant B Data is divided into 100 sec bins |
 |
 |
| Module-wise count rates for Quadrant C Data is divided into 100 sec bins |
 |
 |
| Module-wise count rates for Quadrant D Data is divided into 100 sec bins |
 |
 |
| Parameter | Plot |
|---|---|
| CZT HV Monitor |  |
| D_VDD | 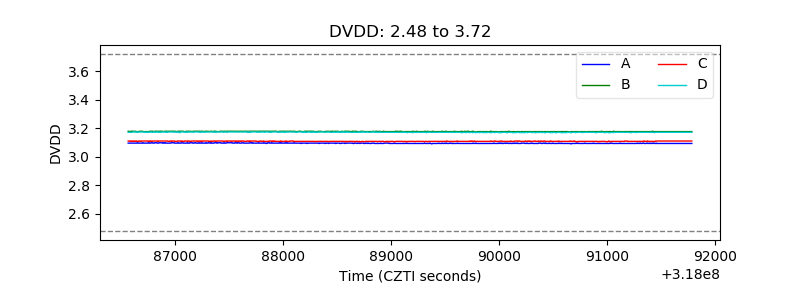 |
| Temperature 1 |  |
| Veto HV Monitor |  |
| Veto LLD | 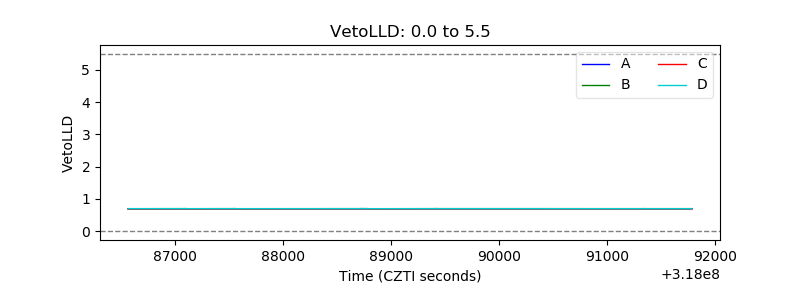 |
| Alpha Counter | 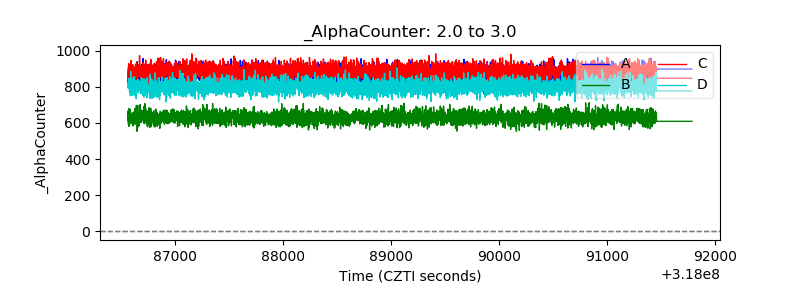 |
| _CPM_Rate | 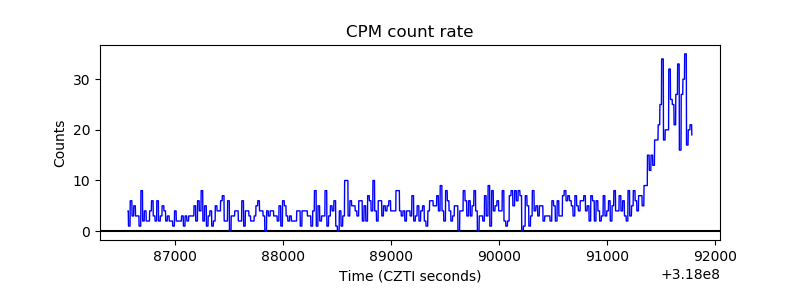 |
| CZT Counter |  |
| +2.5 Volts monitor |  |
| +5 Volts monitor | 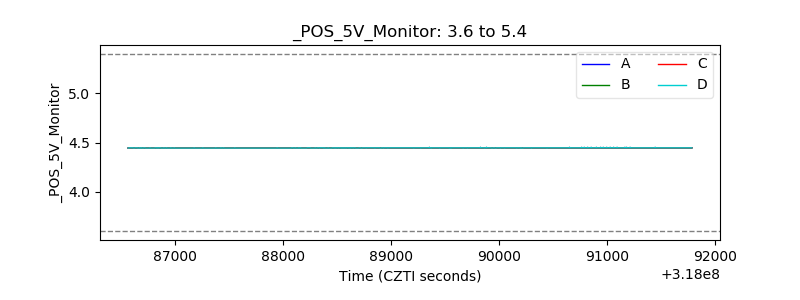 |
| _ROLL_ROT | 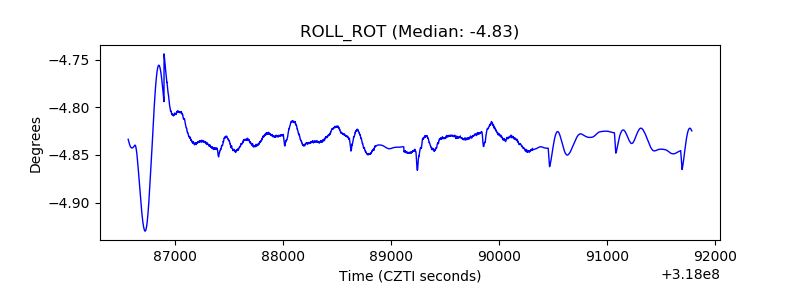 |
| _Roll_DEC | 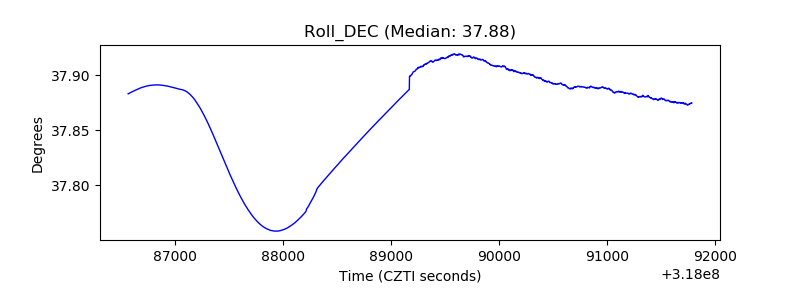 |
| _Roll_RA |  |
| Veto Counter | 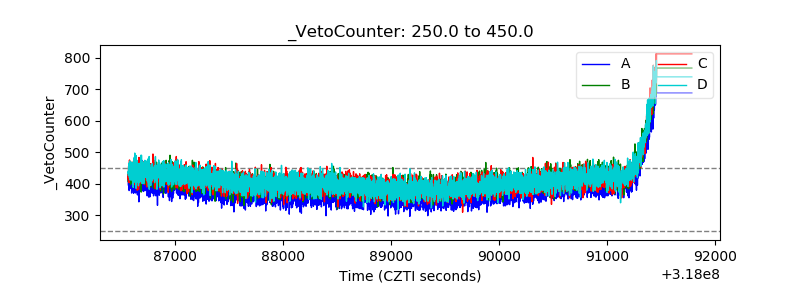 |