| Param | Original file | Final file |
|---|---|---|
| Filename | modeM0/AS1A07_148T02_9000003474cztM0_level2_bc.evt | modeM0/AS1A07_148T02_9000003474cztM0_level2_quad_clean.evt |
| Size (bytes) | 3,670,776,000 | 1,014,076,800 |
| Size | 3.4 GB | 967.1 MB |
| Events in quadrant A | 17,087,817 | 6,512,036 |
| Events in quadrant B | 19,218,402 | 6,602,059 |
| Events in quadrant C | 17,613,014 | 6,399,148 |
| Events in quadrant D | 51,791,954 | 5,702,576 |
| Mode M9 | |||
|---|---|---|---|
| Quadrant | BADHDUFLAG | Total packets | Discarded packets |
| A | 0 | 110 | 0 |
| B | 0 | 111 | 0 |
| C | 0 | 111 | 0 |
| D | 0 | 111 | 0 |
| Mode M0 | |||
|---|---|---|---|
| Quadrant | BADHDUFLAG | Total packets | Discarded packets |
| A | 0 | 167174 | 0 |
| B | 0 | 176017 | 0 |
| C | 0 | 170969 | 0 |
| D | 0 | 289951 | 0 |
| Mode SS | |||
|---|---|---|---|
| Quadrant | BADHDUFLAG | Total packets | Discarded packets |
| A | 0 | 1636 | 0 |
| B | 0 | 1636 | 0 |
| C | 0 | 1634 | 0 |
| D | 0 | 1638 | 0 |
| Quadrant | Total seconds | Saturated seconds | Saturation percentage |
|---|---|---|---|
| A | 80169 | 1020 | 1.272312% |
| B | 80156 | 1585 | 1.977394% |
| C | 80159 | 1507 | 1.880013% |
| D | 80139 | 13524 | 16.875679% |
Noise dominated data is calculated using 1-second bins in cleaned event files. If a bin has >2000 counts, and if more than 50% of those come from <1% of pixels, then it is considered to be noise-dominated and hence unusable.
| Quadrant | # 1 sec bins | Bins with >0 counts | Bins with >2000 counts | High rate bins dominated by noise | Noise dominated (total time) | Noise dominated (detector-on time) | Marked lightcurve |
|---|---|---|---|---|---|---|---|
| A | 95975 | 80287 | 12 | 12 | 0.01% | 0.01% |  |
| B | 95975 | 80267 | 14 | 14 | 0.01% | 0.02% |  |
| C | 95975 | 80264 | 8 | 8 | 0.01% | 0.01% |  |
| D | 95975 | 80251 | 6287 | 6287 | 6.55% | 7.83% |  |
Top three noisy pixels from each quadrant. If the there are fewer than three noisy pixels in the level2.evt file, extra rows are filled as -1
| Pixel properties | Quadrant properties | ||||||
|---|---|---|---|---|---|---|---|
| Quadrant | DetID | PixID | Counts | Sigma | Mean | Median | Sigma |
| A | 13 | 254 | 127936 | 132.56 | 4348 | 4262 | 933.0 |
| A | 6 | 16 | 94192 | 96.39 | 4348 | 4262 | 933.0 |
| A | 4 | 2 | 92243 | 94.3 | 4348 | 4262 | 933.0 |
| B | 0 | 189 | 1512422 | 1846.57 | 4368 | 4257 | 816.7 |
| B | 0 | 183 | 294274 | 355.09 | 4368 | 4257 | 816.7 |
| B | 0 | 230 | 218376 | 262.16 | 4368 | 4257 | 816.7 |
| C | 7 | 247 | 767413 | 766.03 | 4241 | 4225 | 996.3 |
| C | 2 | 16 | 244984 | 241.65 | 4241 | 4225 | 996.3 |
| C | 0 | 207 | 59306 | 55.29 | 4241 | 4225 | 996.3 |
| D | 7 | 238 | 29196073 | 31419.05 | 4054 | 3919 | 929.1 |
| D | 1 | 52 | 5679902 | 6108.97 | 4054 | 3919 | 929.1 |
| D | 2 | 234 | 312329 | 331.94 | 4054 | 3919 | 929.1 |
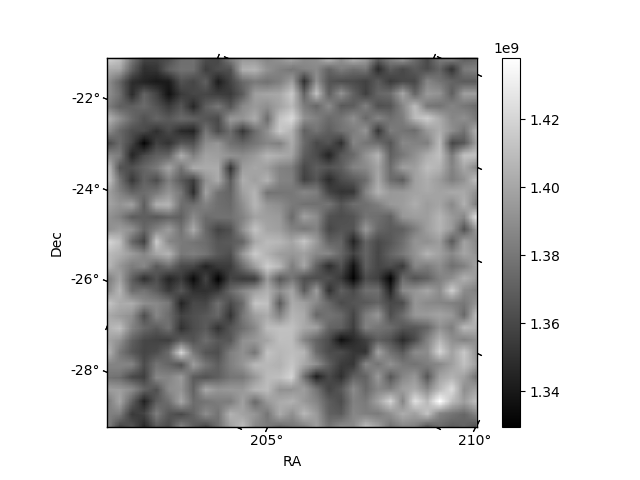
Histogram calculated using DETX and DETY for each event in the final _common_clean file
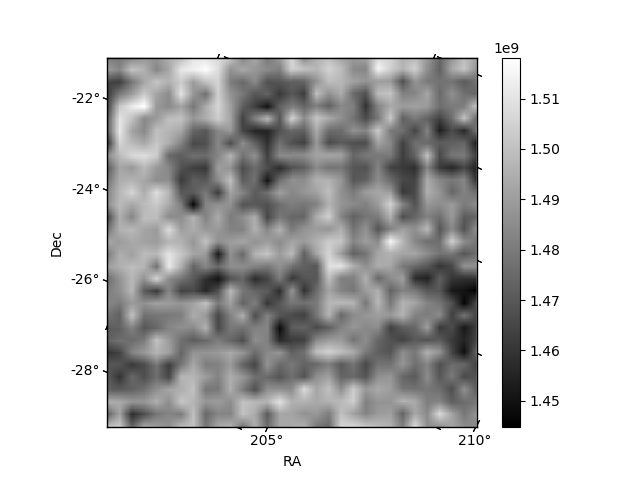
| Quadrant A |  |
 |
Quadrant B |
|---|---|---|---|
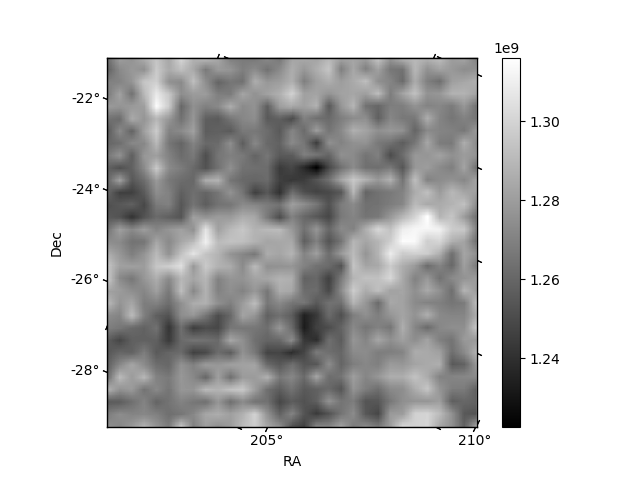
| Quadrant D |  |
 |
Quadrant C |
| Plot type | Count rate plots | Images |
|---|---|---|
| Comparison with Poisson distribution Blue bars denote a histogram of data divided into 1 sec bins. Red curve is a Poisson curve with rate = median count rate of data. |
 |
 |
| Quadrant-wise count rates Data is divided into 100 sec bins |
 |
|
| Module-wise count rates for Quadrant A Data is divided into 100 sec bins |
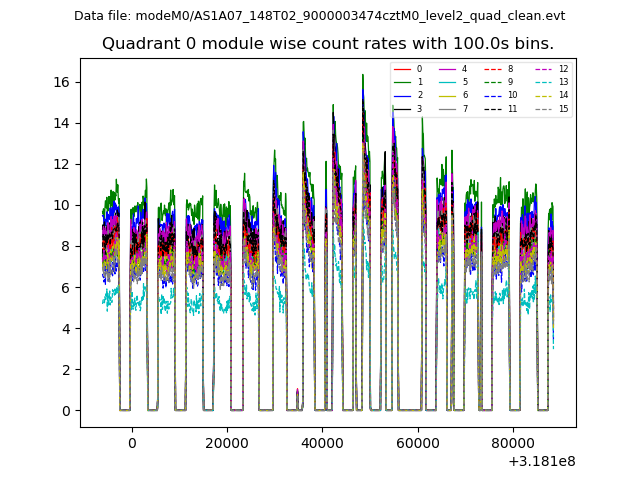 |
 |
| Module-wise count rates for Quadrant B Data is divided into 100 sec bins |
 |
 |
| Module-wise count rates for Quadrant C Data is divided into 100 sec bins |
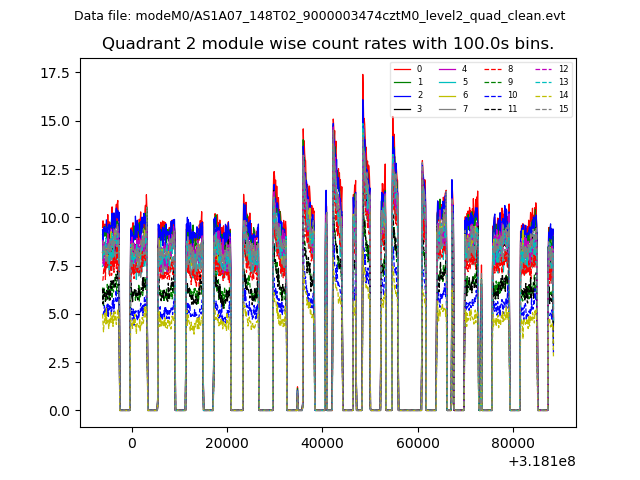 |
 |
| Module-wise count rates for Quadrant D Data is divided into 100 sec bins |
 |
 |
| Parameter | Plot |
|---|---|
| CZT HV Monitor | 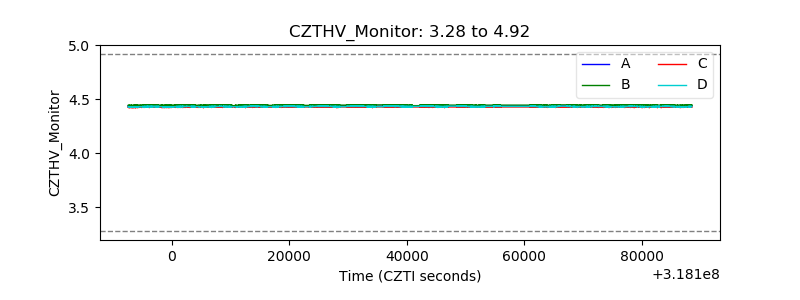 |
| D_VDD |  |
| Temperature 1 | 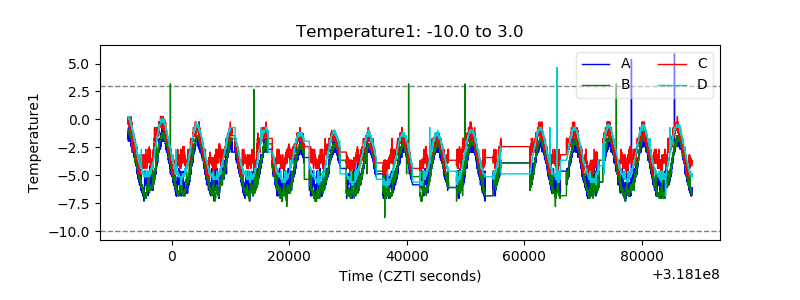 |
| Veto HV Monitor |  |
| Veto LLD |  |
| Alpha Counter | 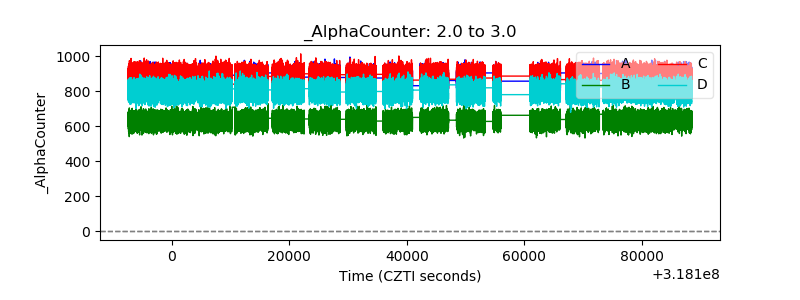 |
| _CPM_Rate |  |
| CZT Counter |  |
| +2.5 Volts monitor |  |
| +5 Volts monitor |  |
| _ROLL_ROT |  |
| _Roll_DEC |  |
| _Roll_RA |  |
| Veto Counter |  |