| Param | Original file | Final file |
|---|---|---|
| Filename | modeM0/AS1A07_127T01_9000003468cztM0_level2_bc.evt | modeM0/AS1A07_127T01_9000003468cztM0_level2_quad_clean.evt |
| Size (bytes) | 2,035,249,920 | 498,444,480 |
| Size | 1.9 GB | 475.4 MB |
| Events in quadrant A | 8,621,911 | 3,188,526 |
| Events in quadrant B | 9,276,373 | 3,207,956 |
| Events in quadrant C | 21,701,069 | 2,976,748 |
| Events in quadrant D | 19,327,349 | 2,990,189 |
| Mode SS | |||
|---|---|---|---|
| Quadrant | BADHDUFLAG | Total packets | Discarded packets |
| A | 0 | 812 | 0 |
| B | 0 | 812 | 0 |
| C | 0 | 812 | 0 |
| D | 0 | 812 | 0 |
| Mode M9 | |||
|---|---|---|---|
| Quadrant | BADHDUFLAG | Total packets | Discarded packets |
| A | 0 | 59 | 0 |
| B | 0 | 59 | 0 |
| C | 0 | 59 | 0 |
| D | 0 | 59 | 0 |
| Mode M0 | |||
|---|---|---|---|
| Quadrant | BADHDUFLAG | Total packets | Discarded packets |
| A | 0 | 83661 | 0 |
| B | 0 | 86336 | 0 |
| C | 0 | 125419 | 0 |
| D | 0 | 117243 | 0 |
| Quadrant | Total seconds | Saturated seconds | Saturation percentage |
|---|---|---|---|
| A | 39783 | 512 | 1.286982% |
| B | 39783 | 714 | 1.794736% |
| C | 39783 | 5441 | 13.676696% |
| D | 39783 | 3537 | 8.890732% |
Noise dominated data is calculated using 1-second bins in cleaned event files. If a bin has >2000 counts, and if more than 50% of those come from <1% of pixels, then it is considered to be noise-dominated and hence unusable.
| Quadrant | # 1 sec bins | Bins with >0 counts | Bins with >2000 counts | High rate bins dominated by noise | Noise dominated (total time) | Noise dominated (detector-on time) | Marked lightcurve |
|---|---|---|---|---|---|---|---|
| A | 44677 | 39779 | 0 | 0 | 0.00% | 0.00% |  |
| B | 44677 | 39778 | 11 | 11 | 0.02% | 0.03% | 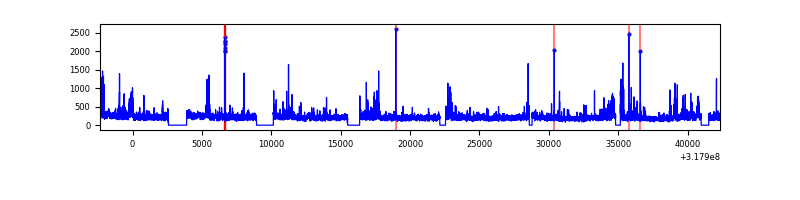 |
| C | 44677 | 39779 | 1437 | 1437 | 3.22% | 3.61% |  |
| D | 44677 | 39776 | 1713 | 1713 | 3.83% | 4.31% |  |
Top three noisy pixels from each quadrant. If the there are fewer than three noisy pixels in the level2.evt file, extra rows are filled as -1
| Pixel properties | Quadrant properties | ||||||
|---|---|---|---|---|---|---|---|
| Quadrant | DetID | PixID | Counts | Sigma | Mean | Median | Sigma |
| A | 13 | 254 | 60565 | 121.92 | 2220 | 2177 | 478.9 |
| A | 15 | 174 | 43243 | 85.75 | 2220 | 2177 | 478.9 |
| A | 0 | 226 | 14507 | 25.75 | 2220 | 2177 | 478.9 |
| B | 0 | 190 | 268387 | 642.15 | 2213 | 2162 | 414.6 |
| B | 0 | 189 | 242529 | 579.78 | 2213 | 2162 | 414.6 |
| B | 0 | 229 | 116736 | 276.36 | 2213 | 2162 | 414.6 |
| C | 10 | 9 | 13624248 | 27963.93 | 2071 | 2061 | 487.1 |
| C | 7 | 247 | 49347 | 97.07 | 2071 | 2061 | 487.1 |
| C | 0 | 207 | 21973 | 40.88 | 2071 | 2061 | 487.1 |
| D | 1 | 52 | 9386608 | 19057.76 | 2131 | 2063 | 492.4 |
| D | 12 | 233 | 582006 | 1177.73 | 2131 | 2063 | 492.4 |
| D | 13 | 172 | 543010 | 1098.53 | 2131 | 2063 | 492.4 |
Histogram calculated using DETX and DETY for each event in the final _common_clean file
| Quadrant A | 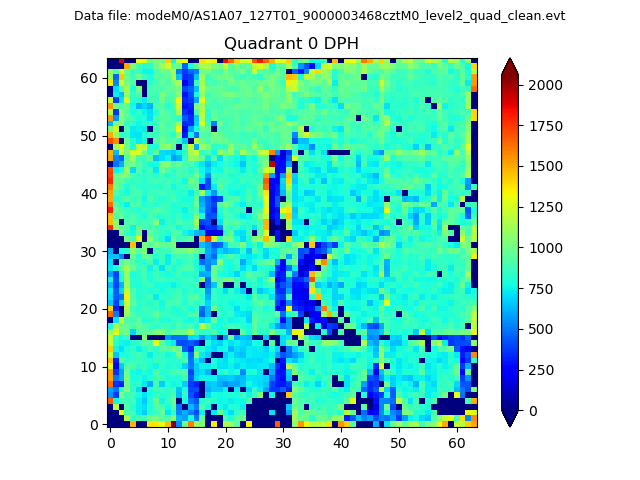 |
 |
Quadrant B |
|---|---|---|---|
| Quadrant D |  |
 |
Quadrant C |
| Plot type | Count rate plots | Images |
|---|---|---|
| Comparison with Poisson distribution Blue bars denote a histogram of data divided into 1 sec bins. Red curve is a Poisson curve with rate = median count rate of data. |
 |
 |
| Quadrant-wise count rates Data is divided into 100 sec bins |
 |
|
| Module-wise count rates for Quadrant A Data is divided into 100 sec bins |
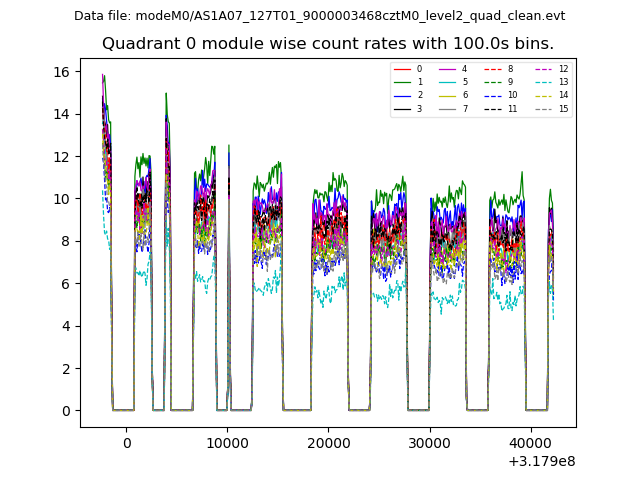 |
 |
| Module-wise count rates for Quadrant B Data is divided into 100 sec bins |
 |
 |
| Module-wise count rates for Quadrant C Data is divided into 100 sec bins |
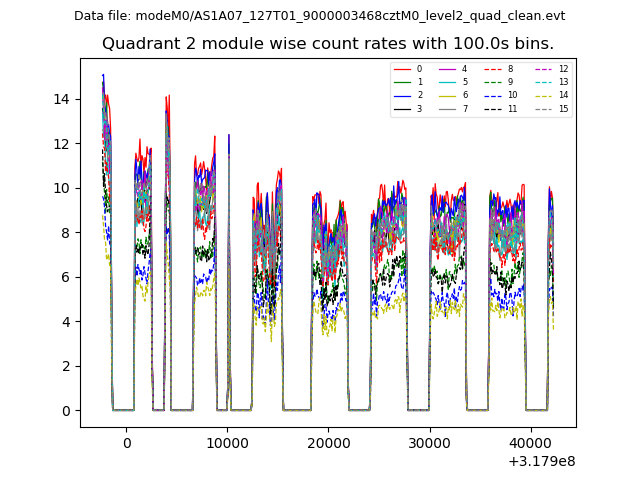 |
 |
| Module-wise count rates for Quadrant D Data is divided into 100 sec bins |
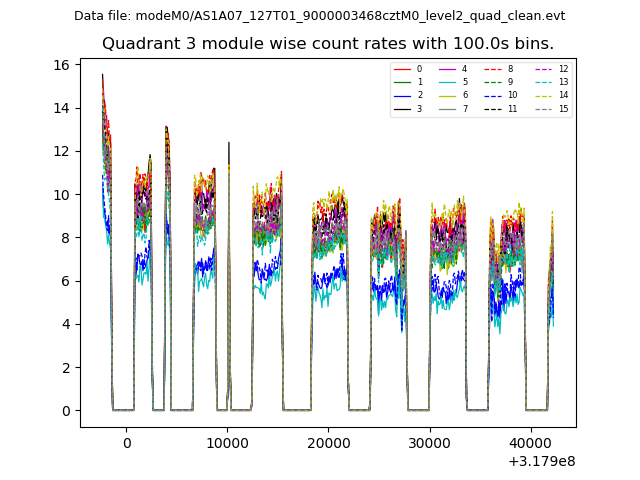 |
 |
| Parameter | Plot |
|---|---|
| CZT HV Monitor | 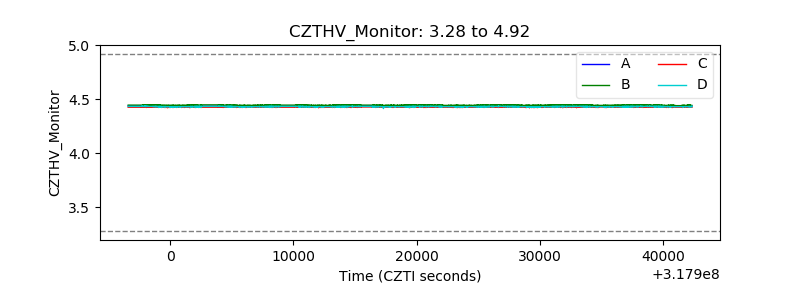 |
| D_VDD |  |
| Temperature 1 |  |
| Veto HV Monitor | 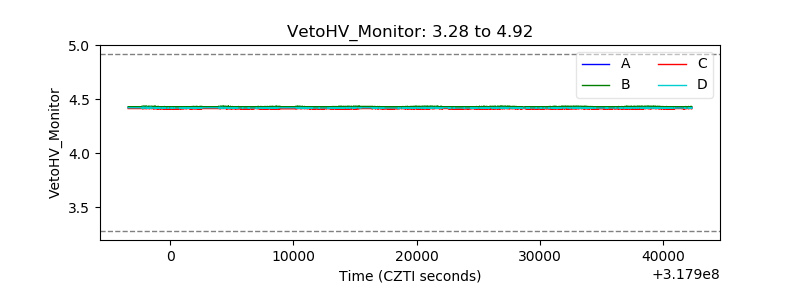 |
| Veto LLD |  |
| Alpha Counter |  |
| _CPM_Rate |  |
| CZT Counter |  |
| +2.5 Volts monitor |  |
| +5 Volts monitor |  |
| _ROLL_ROT |  |
| _Roll_DEC |  |
| _Roll_RA |  |
| Veto Counter |  |