| Param | Original file | Final file |
|---|---|---|
| Filename | modeM0/AS1A07_138T04_9000003462cztM0_level2_bc.evt | modeM0/AS1A07_138T04_9000003462cztM0_level2_quad_clean.evt |
| Size (bytes) | 532,307,520 | 199,543,680 |
| Size | 507.6 MB | 190.3 MB |
| Events in quadrant A | 3,142,434 | 1,283,173 |
| Events in quadrant B | 3,414,213 | 1,295,603 |
| Events in quadrant C | 3,283,965 | 1,238,855 |
| Events in quadrant D | 5,277,849 | 1,217,431 |
| Mode M0 | |||
|---|---|---|---|
| Quadrant | BADHDUFLAG | Total packets | Discarded packets |
| A | 0 | 30360 | 0 |
| B | 0 | 31295 | 0 |
| C | 0 | 30949 | 0 |
| D | 0 | 37012 | 0 |
| Mode SS | |||
|---|---|---|---|
| Quadrant | BADHDUFLAG | Total packets | Discarded packets |
| A | 0 | 300 | 0 |
| B | 0 | 300 | 0 |
| C | 0 | 300 | 0 |
| D | 0 | 300 | 0 |
| Mode M9 | |||
|---|---|---|---|
| Quadrant | BADHDUFLAG | Total packets | Discarded packets |
| A | 0 | 29 | 0 |
| B | 0 | 29 | 0 |
| C | 0 | 29 | 0 |
| D | 0 | 29 | 0 |
| Quadrant | Total seconds | Saturated seconds | Saturation percentage |
|---|---|---|---|
| A | 14600 | 339 | 2.321918% |
| B | 14600 | 382 | 2.616438% |
| C | 14600 | 415 | 2.842466% |
| D | 14600 | 767 | 5.253425% |
Noise dominated data is calculated using 1-second bins in cleaned event files. If a bin has >2000 counts, and if more than 50% of those come from <1% of pixels, then it is considered to be noise-dominated and hence unusable.
| Quadrant | # 1 sec bins | Bins with >0 counts | Bins with >2000 counts | High rate bins dominated by noise | Noise dominated (total time) | Noise dominated (detector-on time) | Marked lightcurve |
|---|---|---|---|---|---|---|---|
| A | 17520 | 14597 | 0 | 0 | 0.00% | 0.00% |  |
| B | 17520 | 14598 | 0 | 0 | 0.00% | 0.00% |  |
| C | 17520 | 14597 | 0 | 0 | 0.00% | 0.00% |  |
| D | 17520 | 14597 | 227 | 227 | 1.30% | 1.56% |  |
Top three noisy pixels from each quadrant. If the there are fewer than three noisy pixels in the level2.evt file, extra rows are filled as -1
| Pixel properties | Quadrant properties | ||||||
|---|---|---|---|---|---|---|---|
| Quadrant | DetID | PixID | Counts | Sigma | Mean | Median | Sigma |
| A | 13 | 254 | 20210 | 108.31 | 813 | 797 | 179.2 |
| A | 12 | 194 | 5282 | 25.02 | 813 | 797 | 179.2 |
| A | 0 | 226 | 5183 | 24.47 | 813 | 797 | 179.2 |
| B | 0 | 189 | 106908 | 689.53 | 815 | 798 | 153.9 |
| B | 0 | 190 | 56699 | 363.26 | 815 | 798 | 153.9 |
| B | 3 | 209 | 36431 | 231.55 | 815 | 798 | 153.9 |
| C | 10 | 9 | 238308 | 1312.34 | 770 | 767 | 181.0 |
| C | 8 | 208 | 64688 | 353.14 | 770 | 767 | 181.0 |
| C | 7 | 247 | 20671 | 109.96 | 770 | 767 | 181.0 |
| D | 1 | 52 | 1807978 | 9758.99 | 787 | 761 | 185.2 |
| D | 12 | 233 | 95021 | 509.01 | 787 | 761 | 185.2 |
| D | 7 | 38 | 80341 | 429.73 | 787 | 761 | 185.2 |
Histogram calculated using DETX and DETY for each event in the final _common_clean file
| Quadrant A |  |
 |
Quadrant B |
|---|---|---|---|
| Quadrant D |  |
 |
Quadrant C |
| Plot type | Count rate plots | Images |
|---|---|---|
| Comparison with Poisson distribution Blue bars denote a histogram of data divided into 1 sec bins. Red curve is a Poisson curve with rate = median count rate of data. |
 |
 |
| Quadrant-wise count rates Data is divided into 100 sec bins |
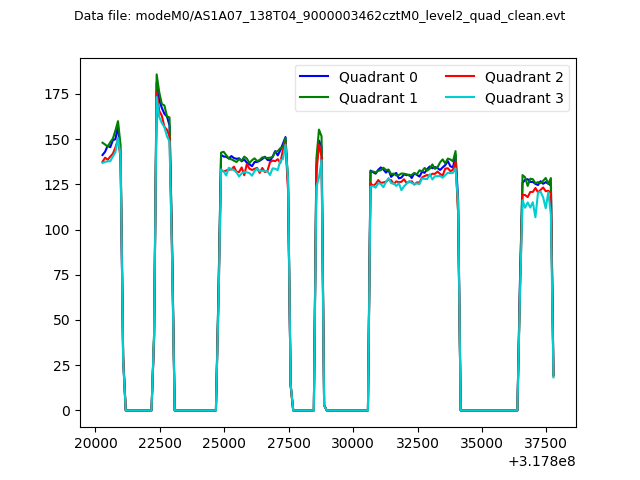 |
|
| Module-wise count rates for Quadrant A Data is divided into 100 sec bins |
 |
 |
| Module-wise count rates for Quadrant B Data is divided into 100 sec bins |
 |
 |
| Module-wise count rates for Quadrant C Data is divided into 100 sec bins |
 |
 |
| Module-wise count rates for Quadrant D Data is divided into 100 sec bins |
 |
 |
| Parameter | Plot |
|---|---|
| CZT HV Monitor |  |
| D_VDD |  |
| Temperature 1 |  |
| Veto HV Monitor |  |
| Veto LLD |  |
| Alpha Counter |  |
| _CPM_Rate |  |
| CZT Counter | 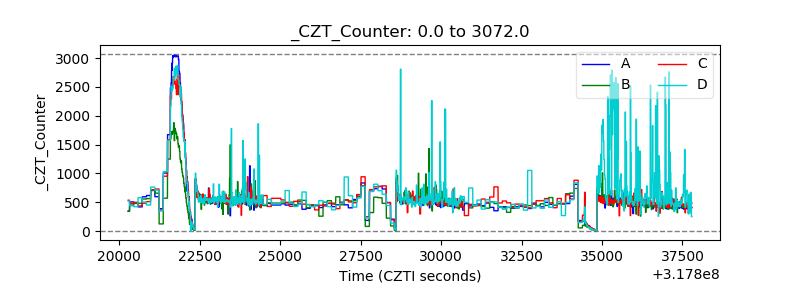 |
| +2.5 Volts monitor |  |
| +5 Volts monitor |  |
| _ROLL_ROT | 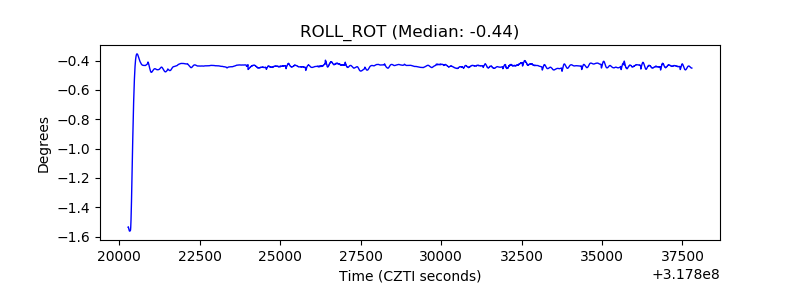 |
| _Roll_DEC | 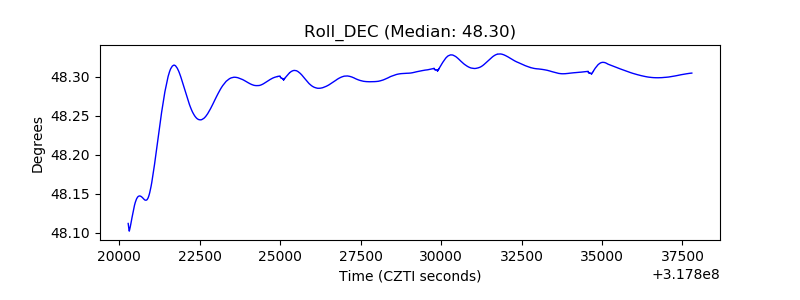 |
| _Roll_RA |  |
| Veto Counter |  |