| Param | Original file | Final file |
|---|---|---|
| Filename | modeM0/AS1A07_138T01_9000003466cztM0_level2_bc.evt | modeM0/AS1A07_138T01_9000003466cztM0_level2_quad_clean.evt |
| Size (bytes) | 1,039,757,760 | 365,166,720 |
| Size | 991.6 MB | 348.3 MB |
| Events in quadrant A | 6,467,791 | 2,310,144 |
| Events in quadrant B | 7,170,258 | 2,332,313 |
| Events in quadrant C | 6,639,283 | 2,223,854 |
| Events in quadrant D | 9,206,499 | 2,176,050 |
| Mode SS | |||
|---|---|---|---|
| Quadrant | BADHDUFLAG | Total packets | Discarded packets |
| A | 0 | 594 | 0 |
| B | 0 | 594 | 0 |
| C | 0 | 594 | 0 |
| D | 0 | 594 | 0 |
| Mode M0 | |||
|---|---|---|---|
| Quadrant | BADHDUFLAG | Total packets | Discarded packets |
| A | 0 | 61293 | 0 |
| B | 0 | 64305 | 0 |
| C | 0 | 62545 | 0 |
| D | 0 | 70048 | 0 |
| Mode M9 | |||
|---|---|---|---|
| Quadrant | BADHDUFLAG | Total packets | Discarded packets |
| A | 0 | 54 | 0 |
| B | 0 | 54 | 0 |
| C | 0 | 54 | 0 |
| D | 0 | 54 | 0 |
| Quadrant | Total seconds | Saturated seconds | Saturation percentage |
|---|---|---|---|
| A | 29367 | 216 | 0.735519% |
| B | 29367 | 360 | 1.225866% |
| C | 29367 | 414 | 1.409746% |
| D | 29367 | 663 | 2.257636% |
Noise dominated data is calculated using 1-second bins in cleaned event files. If a bin has >2000 counts, and if more than 50% of those come from <1% of pixels, then it is considered to be noise-dominated and hence unusable.
| Quadrant | # 1 sec bins | Bins with >0 counts | Bins with >2000 counts | High rate bins dominated by noise | Noise dominated (total time) | Noise dominated (detector-on time) | Marked lightcurve |
|---|---|---|---|---|---|---|---|
| A | 34627 | 29365 | 0 | 0 | 0.00% | 0.00% |  |
| B | 34627 | 29362 | 12 | 12 | 0.03% | 0.04% |  |
| C | 34627 | 29363 | 7 | 7 | 0.02% | 0.02% |  |
| D | 34627 | 29366 | 141 | 141 | 0.41% | 0.48% |  |
Top three noisy pixels from each quadrant. If the there are fewer than three noisy pixels in the level2.evt file, extra rows are filled as -1
| Pixel properties | Quadrant properties | ||||||
|---|---|---|---|---|---|---|---|
| Quadrant | DetID | PixID | Counts | Sigma | Mean | Median | Sigma |
| A | 15 | 174 | 59126 | 161.47 | 1659 | 1632 | 356.1 |
| A | 13 | 254 | 42948 | 116.04 | 1659 | 1632 | 356.1 |
| A | 0 | 226 | 10815 | 25.79 | 1659 | 1632 | 356.1 |
| B | 0 | 189 | 286082 | 923.57 | 1654 | 1616 | 308.0 |
| B | 0 | 190 | 273919 | 884.08 | 1654 | 1616 | 308.0 |
| B | 0 | 229 | 86885 | 276.84 | 1654 | 1616 | 308.0 |
| C | 10 | 9 | 491359 | 1343.75 | 1572 | 1567 | 364.5 |
| C | 7 | 247 | 57213 | 152.67 | 1572 | 1567 | 364.5 |
| C | 0 | 207 | 31178 | 81.24 | 1572 | 1567 | 364.5 |
| D | 1 | 52 | 2520941 | 6898.31 | 1611 | 1560 | 365.2 |
| D | 13 | 104 | 121328 | 327.94 | 1611 | 1560 | 365.2 |
| D | 2 | 234 | 121325 | 327.93 | 1611 | 1560 | 365.2 |
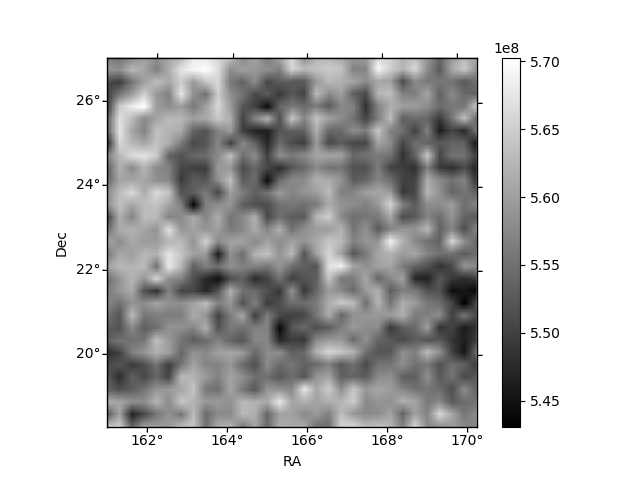
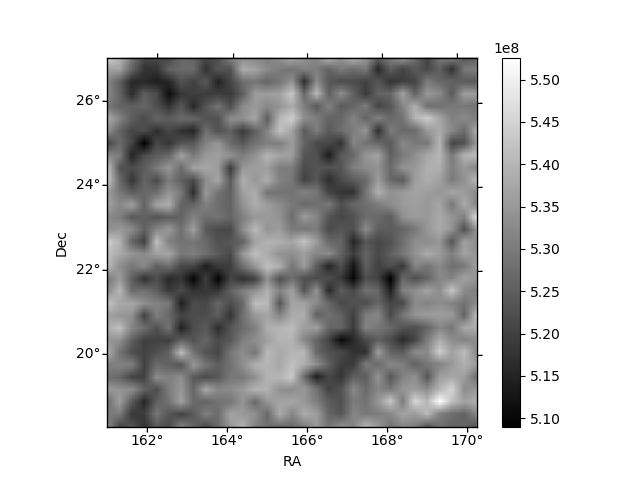
Histogram calculated using DETX and DETY for each event in the final _common_clean file
| Quadrant A |  |
 |
Quadrant B |
|---|---|---|---|
| Quadrant D |  |
 |
Quadrant C |
| Plot type | Count rate plots | Images |
|---|---|---|
| Comparison with Poisson distribution Blue bars denote a histogram of data divided into 1 sec bins. Red curve is a Poisson curve with rate = median count rate of data. |
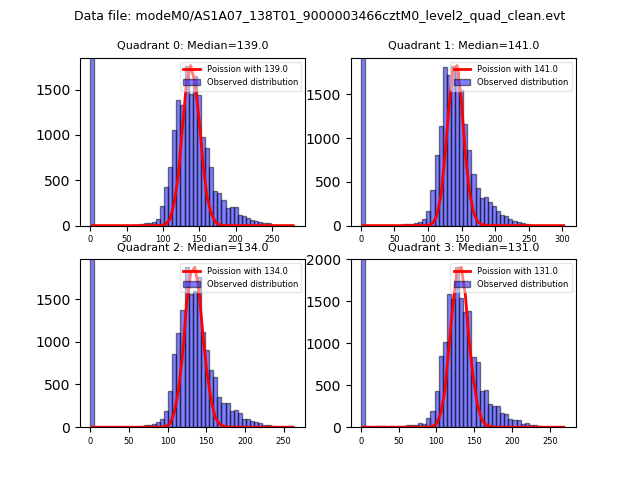 |
 |
| Quadrant-wise count rates Data is divided into 100 sec bins |
 |
|
| Module-wise count rates for Quadrant A Data is divided into 100 sec bins |
 |
 |
| Module-wise count rates for Quadrant B Data is divided into 100 sec bins |
 |
 |
| Module-wise count rates for Quadrant C Data is divided into 100 sec bins |
 |
 |
| Module-wise count rates for Quadrant D Data is divided into 100 sec bins |
 |
 |
| Parameter | Plot |
|---|---|
| CZT HV Monitor | 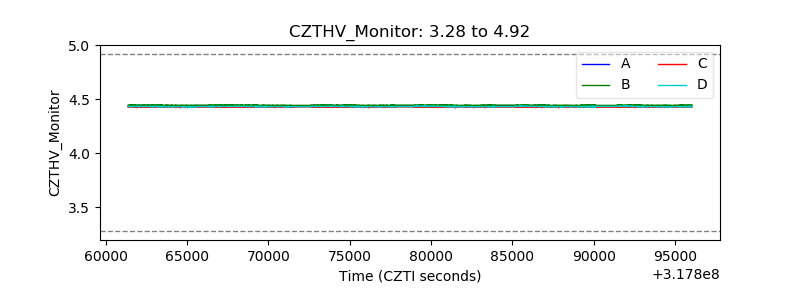 |
| D_VDD |  |
| Temperature 1 |  |
| Veto HV Monitor |  |
| Veto LLD |  |
| Alpha Counter | 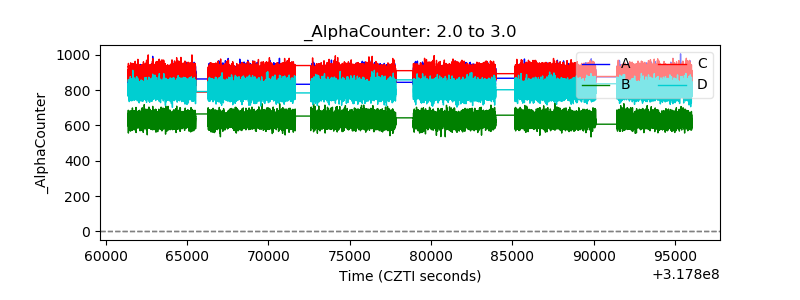 |
| _CPM_Rate |  |
| CZT Counter |  |
| +2.5 Volts monitor | 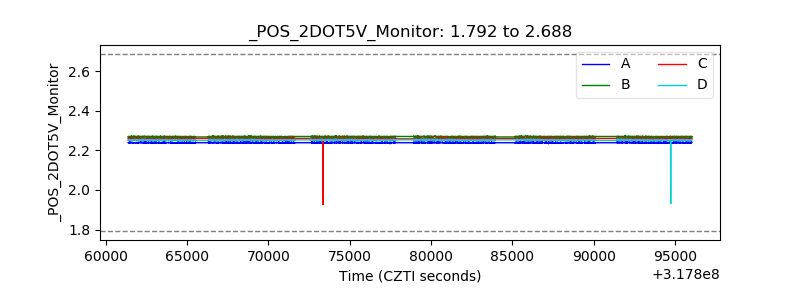 |
| +5 Volts monitor | 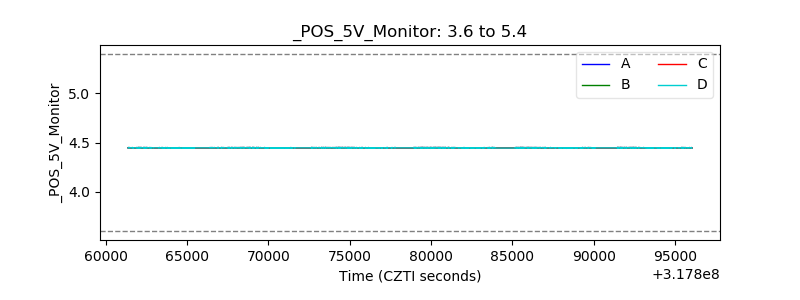 |
| _ROLL_ROT |  |
| _Roll_DEC |  |
| _Roll_RA |  |
| Veto Counter | 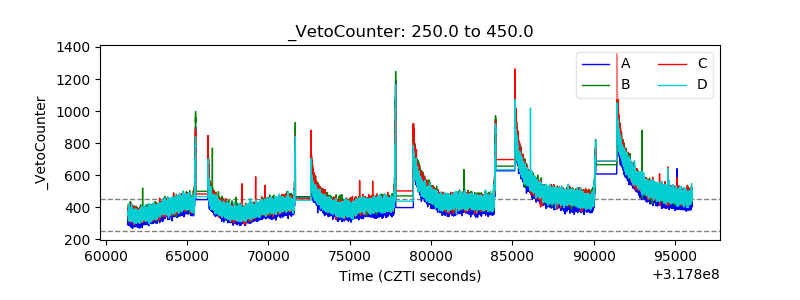 |