| Param | Original file | Final file |
|---|---|---|
| Filename | modeM0/AS1A07_127T02_9000003460cztM0_level2_bc.evt | modeM0/AS1A07_127T02_9000003460cztM0_level2_quad_clean.evt |
| Size (bytes) | 5,470,551,360 | 1,769,555,520 |
| Size | 5.1 GB | 1.6 GB |
| Events in quadrant A | 31,743,761 | 11,623,150 |
| Events in quadrant B | 29,964,384 | 11,748,252 |
| Events in quadrant C | 29,809,672 | 11,062,380 |
| Events in quadrant D | 65,312,228 | 10,259,765 |
| Mode M9 | |||
|---|---|---|---|
| Quadrant | BADHDUFLAG | Total packets | Discarded packets |
| A | 0 | 201 | 0 |
| B | 0 | 201 | 0 |
| C | 0 | 201 | 0 |
| D | 0 | 201 | 0 |
| Mode M0 | |||
|---|---|---|---|
| Quadrant | BADHDUFLAG | Total packets | Discarded packets |
| A | 0 | 284231 | 0 |
| B | 0 | 280194 | 0 |
| C | 0 | 280541 | 0 |
| D | 0 | 402860 | 0 |
| Mode SS | |||
|---|---|---|---|
| Quadrant | BADHDUFLAG | Total packets | Discarded packets |
| A | 0 | 2644 | 0 |
| B | 0 | 2644 | 0 |
| C | 0 | 2646 | 0 |
| D | 0 | 2644 | 0 |
| Quadrant | Total seconds | Saturated seconds | Saturation percentage |
|---|---|---|---|
| A | 129946 | 1753 | 1.349022% |
| B | 129948 | 1780 | 1.369779% |
| C | 129946 | 2497 | 1.921567% |
| D | 129943 | 16717 | 12.864872% |
Noise dominated data is calculated using 1-second bins in cleaned event files. If a bin has >2000 counts, and if more than 50% of those come from <1% of pixels, then it is considered to be noise-dominated and hence unusable.
| Quadrant | # 1 sec bins | Bins with >0 counts | Bins with >2000 counts | High rate bins dominated by noise | Noise dominated (total time) | Noise dominated (detector-on time) | Marked lightcurve |
|---|---|---|---|---|---|---|---|
| A | 155493 | 129943 | 245 | 245 | 0.16% | 0.19% |  |
| B | 155493 | 129942 | 25 | 25 | 0.02% | 0.02% |  |
| C | 155493 | 129944 | 285 | 285 | 0.18% | 0.22% |  |
| D | 155493 | 129941 | 8391 | 8391 | 5.40% | 6.46% |  |
Top three noisy pixels from each quadrant. If the there are fewer than three noisy pixels in the level2.evt file, extra rows are filled as -1
| Pixel properties | Quadrant properties | ||||||
|---|---|---|---|---|---|---|---|
| Quadrant | DetID | PixID | Counts | Sigma | Mean | Median | Sigma |
| A | 6 | 16 | 3959244 | 2567.29 | 7170 | 7047 | 1539.4 |
| A | 13 | 254 | 191922 | 120.09 | 7170 | 7047 | 1539.4 |
| A | 15 | 174 | 93091 | 55.89 | 7170 | 7047 | 1539.4 |
| B | 0 | 189 | 1081334 | 801.42 | 7208 | 7046 | 1340.5 |
| B | 0 | 190 | 577232 | 425.36 | 7208 | 7046 | 1340.5 |
| B | 0 | 229 | 211150 | 152.26 | 7208 | 7046 | 1340.5 |
| C | 10 | 9 | 3253939 | 2044.23 | 6801 | 6785 | 1588.4 |
| C | 2 | 16 | 110734 | 65.44 | 6801 | 6785 | 1588.4 |
| C | 7 | 247 | 102358 | 60.17 | 6801 | 6785 | 1588.4 |
| D | 1 | 52 | 36566655 | 23863.95 | 6602 | 6371 | 1532.0 |
| D | 7 | 238 | 2119318 | 1379.18 | 6602 | 6371 | 1532.0 |
| D | 2 | 234 | 515993 | 332.64 | 6602 | 6371 | 1532.0 |
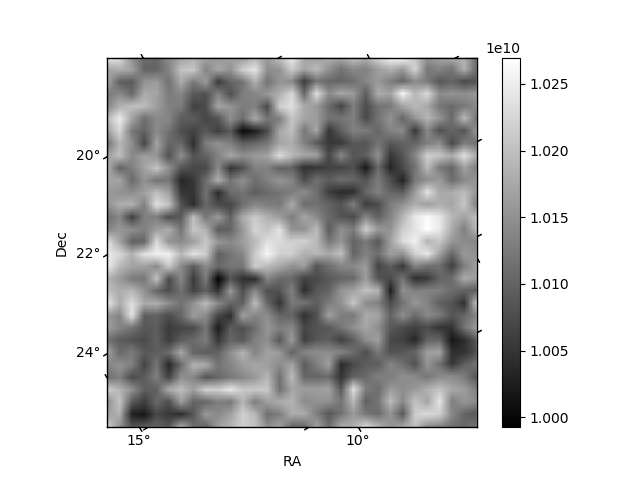
Histogram calculated using DETX and DETY for each event in the final _common_clean file
| Quadrant A |  |
 |
Quadrant B |
|---|---|---|---|
| Quadrant D |  |
 |
Quadrant C |
| Plot type | Count rate plots | Images |
|---|---|---|
| Comparison with Poisson distribution Blue bars denote a histogram of data divided into 1 sec bins. Red curve is a Poisson curve with rate = median count rate of data. |
 |
 |
| Quadrant-wise count rates Data is divided into 100 sec bins |
 |
|
| Module-wise count rates for Quadrant A Data is divided into 100 sec bins |
 |
 |
| Module-wise count rates for Quadrant B Data is divided into 100 sec bins |
 |
 |
| Module-wise count rates for Quadrant C Data is divided into 100 sec bins |
 |
 |
| Module-wise count rates for Quadrant D Data is divided into 100 sec bins |
 |
 |
| Parameter | Plot |
|---|---|
| CZT HV Monitor |  |
| D_VDD |  |
| Temperature 1 |  |
| Veto HV Monitor |  |
| Veto LLD |  |
| Alpha Counter |  |
| _CPM_Rate |  |
| CZT Counter |  |
| +2.5 Volts monitor |  |
| +5 Volts monitor | 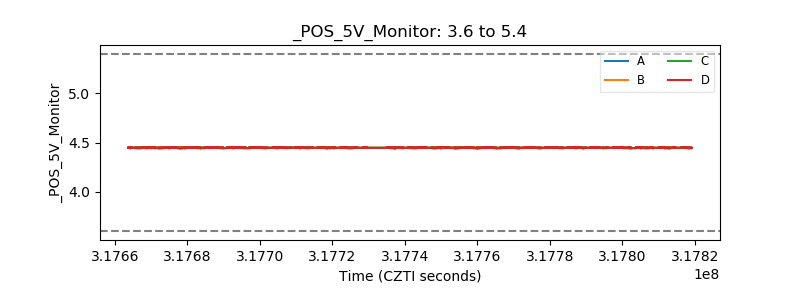 |
| _ROLL_ROT |  |
| _Roll_DEC |  |
| _Roll_RA |  |
| Veto Counter |  |