| Param | Original file | Final file |
|---|---|---|
| Filename | modeM0/AS1C05_002T04_9000003454cztM0_level2_bc.evt | modeM0/AS1C05_002T04_9000003454cztM0_level2_quad_clean.evt |
| Size (bytes) | 201,156,480 | 61,312,320 |
| Size | 191.8 MB | 58.5 MB |
| Events in quadrant A | 1,114,534 | 390,472 |
| Events in quadrant B | 1,181,225 | 394,719 |
| Events in quadrant C | 1,940,643 | 378,706 |
| Events in quadrant D | 1,539,520 | 373,955 |
| Mode M9 | |||
|---|---|---|---|
| Quadrant | BADHDUFLAG | Total packets | Discarded packets |
| A | 0 | 13 | 0 |
| B | 0 | 13 | 0 |
| C | 0 | 13 | 0 |
| D | 0 | 13 | 0 |
| Mode SS | |||
|---|---|---|---|
| Quadrant | BADHDUFLAG | Total packets | Discarded packets |
| A | 0 | 92 | 0 |
| B | 0 | 92 | 0 |
| C | 0 | 92 | 0 |
| D | 0 | 92 | 0 |
| Mode M0 | |||
|---|---|---|---|
| Quadrant | BADHDUFLAG | Total packets | Discarded packets |
| A | 0 | 9925 | 0 |
| B | 0 | 10162 | 0 |
| C | 0 | 13034 | 0 |
| D | 0 | 11183 | 0 |
| Quadrant | Total seconds | Saturated seconds | Saturation percentage |
|---|---|---|---|
| A | 4535 | 74 | 1.631753% |
| B | 4535 | 79 | 1.742007% |
| C | 4535 | 153 | 3.373760% |
| D | 4535 | 114 | 2.513782% |
Noise dominated data is calculated using 1-second bins in cleaned event files. If a bin has >2000 counts, and if more than 50% of those come from <1% of pixels, then it is considered to be noise-dominated and hence unusable.
| Quadrant | # 1 sec bins | Bins with >0 counts | Bins with >2000 counts | High rate bins dominated by noise | Noise dominated (total time) | Noise dominated (detector-on time) | Marked lightcurve |
|---|---|---|---|---|---|---|---|
| A | 5860 | 4534 | 0 | 0 | 0.00% | 0.00% |  |
| B | 5860 | 4535 | 0 | 0 | 0.00% | 0.00% |  |
| C | 5860 | 4534 | 1 | 1 | 0.02% | 0.02% |  |
| D | 5860 | 4535 | 6 | 6 | 0.10% | 0.13% |  |
Top three noisy pixels from each quadrant. If the there are fewer than three noisy pixels in the level2.evt file, extra rows are filled as -1
| Pixel properties | Quadrant properties | ||||||
|---|---|---|---|---|---|---|---|
| Quadrant | DetID | PixID | Counts | Sigma | Mean | Median | Sigma |
| A | 13 | 254 | 6609 | 100.27 | 288 | 283 | 63.1 |
| A | 12 | 16 | 3040 | 43.7 | 288 | 283 | 63.1 |
| A | 12 | 194 | 2454 | 34.41 | 288 | 283 | 63.1 |
| B | 0 | 189 | 36082 | 650.3 | 288 | 283 | 55.1 |
| B | 0 | 190 | 20209 | 361.96 | 288 | 283 | 55.1 |
| B | 0 | 229 | 8826 | 155.19 | 288 | 283 | 55.1 |
| C | 0 | 239 | 859215 | 13145.0 | 277 | 277 | 65.3 |
| C | 7 | 247 | 12707 | 190.23 | 277 | 277 | 65.3 |
| C | 2 | 16 | 3437 | 48.36 | 277 | 277 | 65.3 |
| D | 1 | 52 | 299524 | 4443.49 | 285 | 276 | 67.3 |
| D | 6 | 112 | 61436 | 908.16 | 285 | 276 | 67.3 |
| D | 12 | 233 | 26279 | 386.11 | 285 | 276 | 67.3 |
Histogram calculated using DETX and DETY for each event in the final _common_clean file
| Quadrant A |  |
 |
Quadrant B |
|---|---|---|---|
| Quadrant D |  |
 |
Quadrant C |
| Plot type | Count rate plots | Images |
|---|---|---|
| Comparison with Poisson distribution Blue bars denote a histogram of data divided into 1 sec bins. Red curve is a Poisson curve with rate = median count rate of data. |
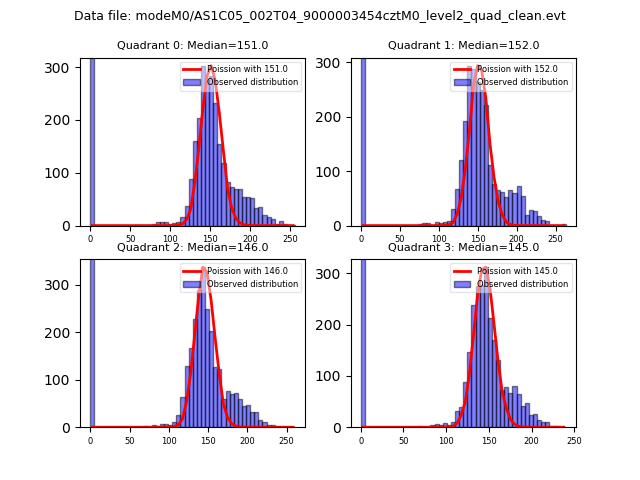 |
 |
| Quadrant-wise count rates Data is divided into 100 sec bins |
 |
|
| Module-wise count rates for Quadrant A Data is divided into 100 sec bins |
 |
 |
| Module-wise count rates for Quadrant B Data is divided into 100 sec bins |
 |
 |
| Module-wise count rates for Quadrant C Data is divided into 100 sec bins |
 |
 |
| Module-wise count rates for Quadrant D Data is divided into 100 sec bins |
 |
 |
| Parameter | Plot |
|---|---|
| CZT HV Monitor |  |
| D_VDD |  |
| Temperature 1 |  |
| Veto HV Monitor |  |
| Veto LLD |  |
| Alpha Counter |  |
| _CPM_Rate |  |
| CZT Counter | 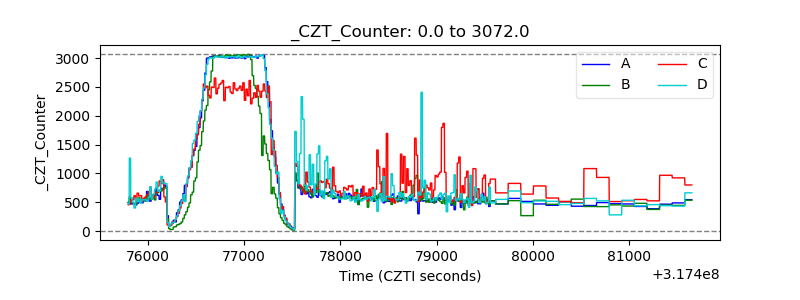 |
| +2.5 Volts monitor |  |
| +5 Volts monitor |  |
| _ROLL_ROT |  |
| _Roll_DEC |  |
| _Roll_RA |  |
| Veto Counter |  |