| Param | Original file | Final file |
|---|---|---|
| Filename | modeM0/AS1A07_138T09_9000003458cztM0_level2_bc.evt | modeM0/AS1A07_138T09_9000003458cztM0_level2_quad_clean.evt |
| Size (bytes) | 4,752,581,760 | 1,701,622,080 |
| Size | 4.4 GB | 1.6 GB |
| Events in quadrant A | 26,183,842 | 10,921,030 |
| Events in quadrant B | 29,257,716 | 11,047,307 |
| Events in quadrant C | 36,928,837 | 10,598,102 |
| Events in quadrant D | 43,039,064 | 10,395,241 |
| Mode SS | |||
|---|---|---|---|
| Quadrant | BADHDUFLAG | Total packets | Discarded packets |
| A | 0 | 2548 | 0 |
| B | 0 | 2550 | 0 |
| C | 0 | 2548 | 0 |
| D | 0 | 2546 | 0 |
| Mode M9 | |||
|---|---|---|---|
| Quadrant | BADHDUFLAG | Total packets | Discarded packets |
| A | 0 | 207 | 0 |
| B | 0 | 207 | 0 |
| C | 0 | 207 | 0 |
| D | 0 | 207 | 0 |
| Mode M0 | |||
|---|---|---|---|
| Quadrant | BADHDUFLAG | Total packets | Discarded packets |
| A | 0 | 257828 | 0 |
| B | 0 | 269590 | 0 |
| C | 0 | 294745 | 0 |
| D | 0 | 312757 | 0 |
| Quadrant | Total seconds | Saturated seconds | Saturation percentage |
|---|---|---|---|
| A | 125261 | 931 | 0.743248% |
| B | 125256 | 1533 | 1.223893% |
| C | 125254 | 2874 | 2.294537% |
| D | 125255 | 3162 | 2.524450% |
Noise dominated data is calculated using 1-second bins in cleaned event files. If a bin has >2000 counts, and if more than 50% of those come from <1% of pixels, then it is considered to be noise-dominated and hence unusable.
| Quadrant | # 1 sec bins | Bins with >0 counts | Bins with >2000 counts | High rate bins dominated by noise | Noise dominated (total time) | Noise dominated (detector-on time) | Marked lightcurve |
|---|---|---|---|---|---|---|---|
| A | 158046 | 125334 | 5 | 5 | 0.00% | 0.00% |  |
| B | 158046 | 125326 | 55 | 55 | 0.03% | 0.04% | 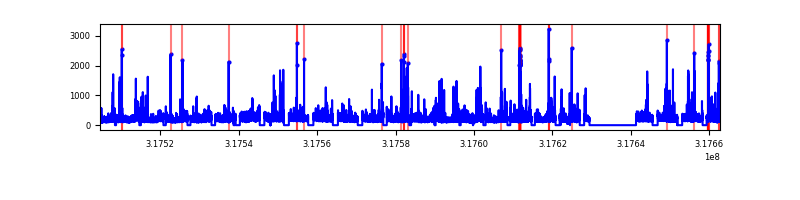 |
| C | 158046 | 125328 | 85 | 85 | 0.05% | 0.07% |  |
| D | 158046 | 125343 | 788 | 788 | 0.50% | 0.63% |  |
Top three noisy pixels from each quadrant. If the there are fewer than three noisy pixels in the level2.evt file, extra rows are filled as -1
| Pixel properties | Quadrant properties | ||||||
|---|---|---|---|---|---|---|---|
| Quadrant | DetID | PixID | Counts | Sigma | Mean | Median | Sigma |
| A | 15 | 174 | 199072 | 131.83 | 6737 | 6624 | 1459.8 |
| A | 13 | 254 | 173923 | 114.6 | 6737 | 6624 | 1459.8 |
| A | 0 | 226 | 43633 | 25.35 | 6737 | 6624 | 1459.8 |
| B | 0 | 189 | 1782184 | 1410.88 | 6744 | 6590 | 1258.5 |
| B | 0 | 190 | 699692 | 550.73 | 6744 | 6590 | 1258.5 |
| B | 0 | 229 | 503802 | 395.08 | 6744 | 6590 | 1258.5 |
| C | 0 | 239 | 9491280 | 6245.64 | 6472 | 6452 | 1518.6 |
| C | 10 | 9 | 1224713 | 802.21 | 6472 | 6452 | 1518.6 |
| C | 7 | 247 | 816322 | 533.29 | 6472 | 6452 | 1518.6 |
| D | 1 | 52 | 13133977 | 8497.43 | 6615 | 6395 | 1544.9 |
| D | 7 | 238 | 2094063 | 1351.34 | 6615 | 6395 | 1544.9 |
| D | 13 | 104 | 725545 | 465.5 | 6615 | 6395 | 1544.9 |
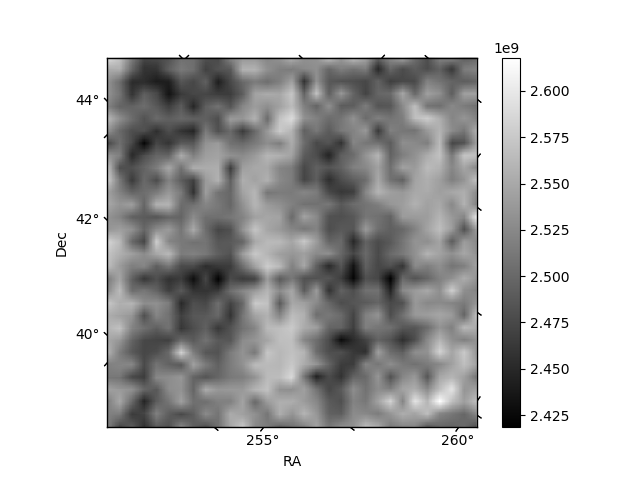
Histogram calculated using DETX and DETY for each event in the final _common_clean file
| Quadrant A | 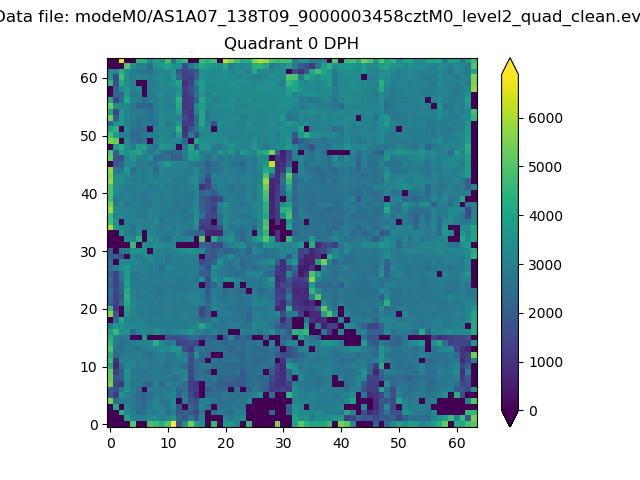 |
 |
Quadrant B |
|---|---|---|---|
| Quadrant D | 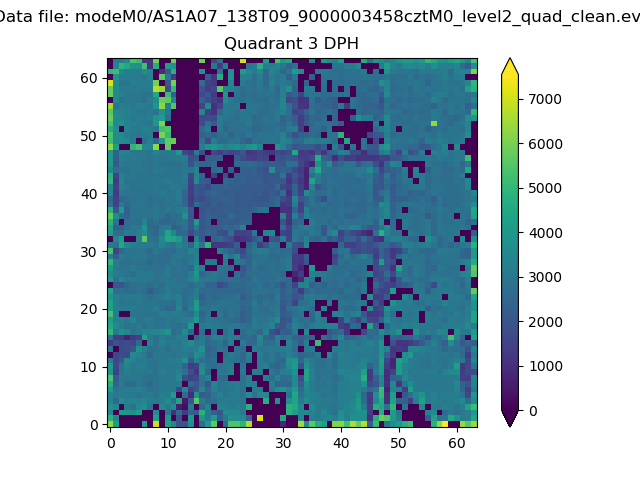 |
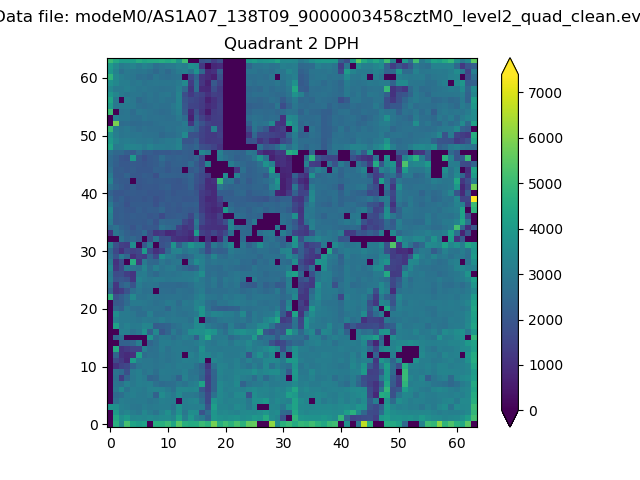 |
Quadrant C |
| Plot type | Count rate plots | Images |
|---|---|---|
| Comparison with Poisson distribution Blue bars denote a histogram of data divided into 1 sec bins. Red curve is a Poisson curve with rate = median count rate of data. |
 |
 |
| Quadrant-wise count rates Data is divided into 100 sec bins |
 |
|
| Module-wise count rates for Quadrant A Data is divided into 100 sec bins |
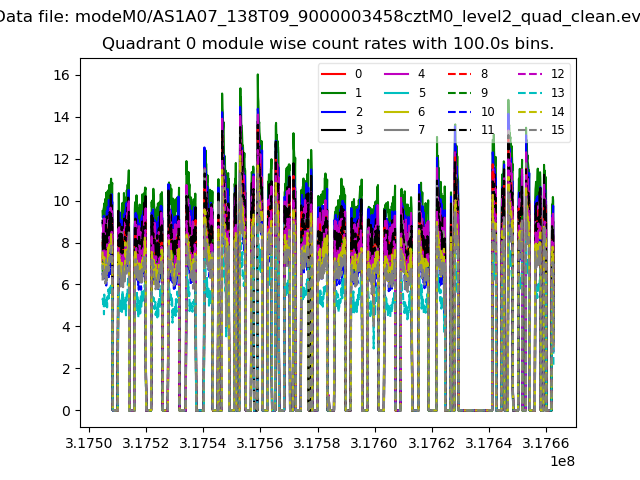 |
 |
| Module-wise count rates for Quadrant B Data is divided into 100 sec bins |
 |
 |
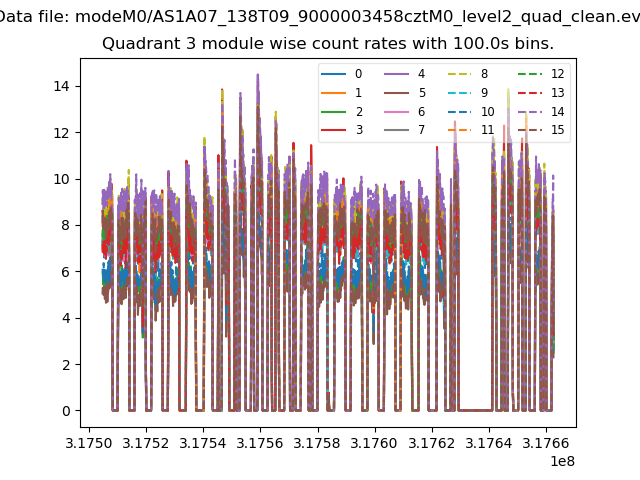
| Module-wise count rates for Quadrant C Data is divided into 100 sec bins |
 |
 |
| Module-wise count rates for Quadrant D Data is divided into 100 sec bins |
 |
 |
| Parameter | Plot |
|---|---|
| CZT HV Monitor | 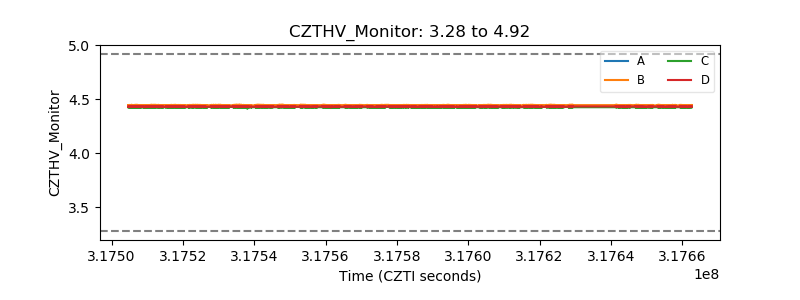 |
| D_VDD |  |
| Temperature 1 |  |
| Veto HV Monitor |  |
| Veto LLD | 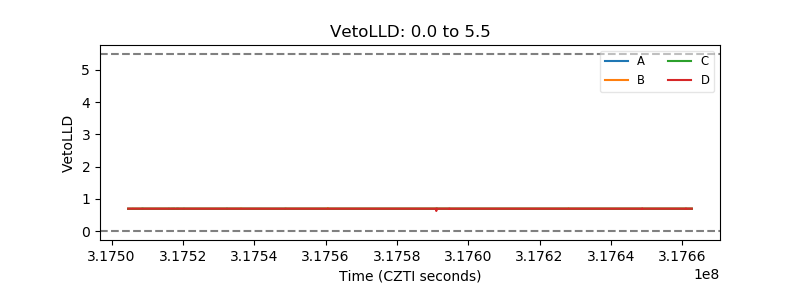 |
| Alpha Counter |  |
| _CPM_Rate | 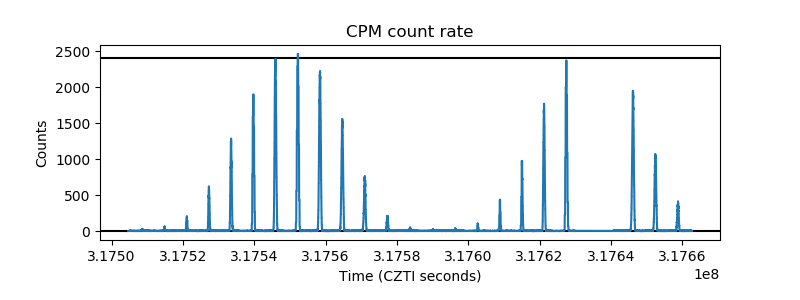 |
| CZT Counter |  |
| +2.5 Volts monitor |  |
| +5 Volts monitor | 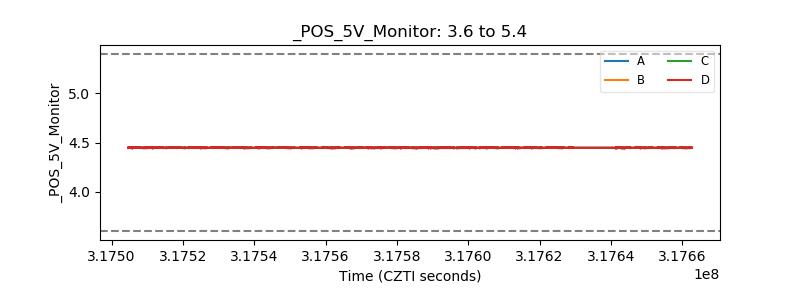 |
| _ROLL_ROT | 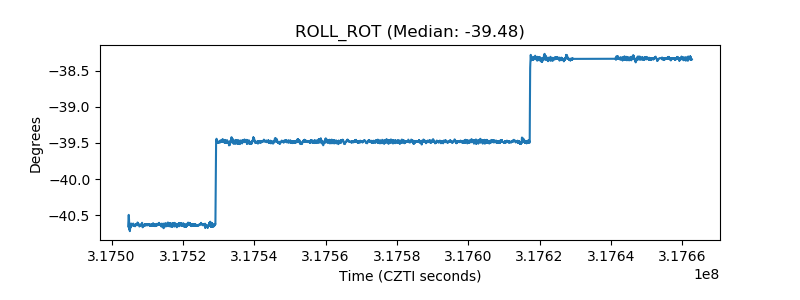 |
| _Roll_DEC | 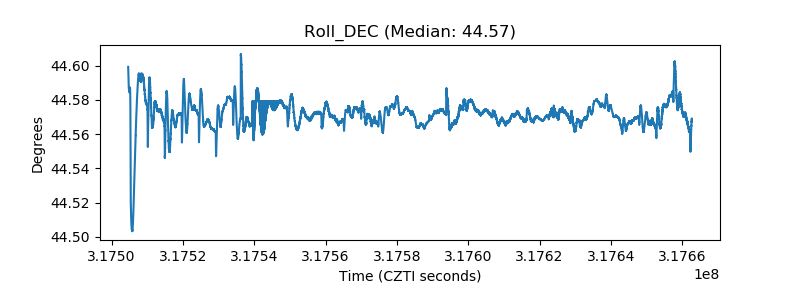 |
| _Roll_RA |  |
| Veto Counter | 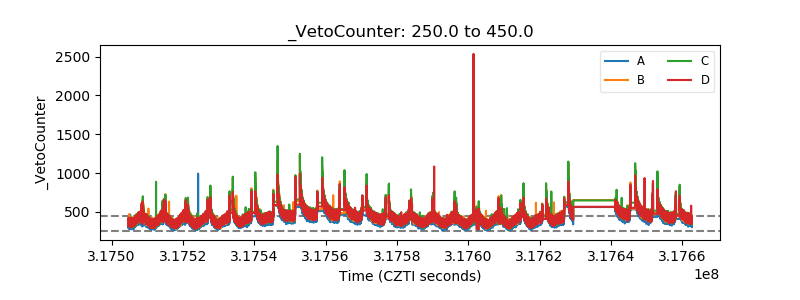 |