| Param | Original file | Final file |
|---|---|---|
| Filename | modeM0/AS1A07_138T06_9000003456cztM0_level2_bc.evt | modeM0/AS1A07_138T06_9000003456cztM0_level2_quad_clean.evt |
| Size (bytes) | 842,250,240 | 264,208,320 |
| Size | 803.2 MB | 252.0 MB |
| Events in quadrant A | 3,956,221 | 1,711,382 |
| Events in quadrant B | 4,247,177 | 1,727,425 |
| Events in quadrant C | 11,030,053 | 1,620,863 |
| Events in quadrant D | 4,993,725 | 1,651,957 |
| Mode M0 | |||
|---|---|---|---|
| Quadrant | BADHDUFLAG | Total packets | Discarded packets |
| A | 0 | 38869 | 0 |
| B | 0 | 39966 | 0 |
| C | 0 | 64562 | 0 |
| D | 0 | 41955 | 0 |
| Mode M9 | |||
|---|---|---|---|
| Quadrant | BADHDUFLAG | Total packets | Discarded packets |
| A | 0 | 32 | 0 |
| B | 0 | 32 | 0 |
| C | 0 | 32 | 0 |
| D | 0 | 32 | 0 |
| Mode SS | |||
|---|---|---|---|
| Quadrant | BADHDUFLAG | Total packets | Discarded packets |
| A | 0 | 386 | 0 |
| B | 0 | 386 | 0 |
| C | 0 | 386 | 0 |
| D | 0 | 386 | 0 |
| Quadrant | Total seconds | Saturated seconds | Saturation percentage |
|---|---|---|---|
| A | 18716 | 299 | 1.597564% |
| B | 18716 | 394 | 2.105151% |
| C | 18716 | 1532 | 8.185510% |
| D | 18716 | 383 | 2.046377% |
Noise dominated data is calculated using 1-second bins in cleaned event files. If a bin has >2000 counts, and if more than 50% of those come from <1% of pixels, then it is considered to be noise-dominated and hence unusable.
| Quadrant | # 1 sec bins | Bins with >0 counts | Bins with >2000 counts | High rate bins dominated by noise | Noise dominated (total time) | Noise dominated (detector-on time) | Marked lightcurve |
|---|---|---|---|---|---|---|---|
| A | 22071 | 18714 | 0 | 0 | 0.00% | 0.00% |  |
| B | 22071 | 18713 | 4 | 4 | 0.02% | 0.02% |  |
| C | 22071 | 18712 | 82 | 82 | 0.37% | 0.44% |  |
| D | 22071 | 18713 | 24 | 24 | 0.11% | 0.13% |  |
Top three noisy pixels from each quadrant. If the there are fewer than three noisy pixels in the level2.evt file, extra rows are filled as -1
| Pixel properties | Quadrant properties | ||||||
|---|---|---|---|---|---|---|---|
| Quadrant | DetID | PixID | Counts | Sigma | Mean | Median | Sigma |
| A | 13 | 254 | 29403 | 126.81 | 1024 | 1004 | 224.0 |
| A | 12 | 194 | 6659 | 25.25 | 1024 | 1004 | 224.0 |
| A | 0 | 226 | 6614 | 25.05 | 1024 | 1004 | 224.0 |
| B | 0 | 189 | 86374 | 440.28 | 1024 | 1003 | 193.9 |
| B | 0 | 190 | 75918 | 386.35 | 1024 | 1003 | 193.9 |
| B | 0 | 229 | 42032 | 211.6 | 1024 | 1003 | 193.9 |
| C | 0 | 239 | 7177643 | 31482.75 | 966 | 961 | 228.0 |
| C | 7 | 247 | 81105 | 351.58 | 966 | 961 | 228.0 |
| C | 2 | 16 | 18091 | 75.15 | 966 | 961 | 228.0 |
| D | 1 | 52 | 436155 | 1857.4 | 1013 | 981 | 234.3 |
| D | 2 | 152 | 183999 | 781.15 | 1013 | 981 | 234.3 |
| D | 7 | 38 | 120749 | 511.19 | 1013 | 981 | 234.3 |
Histogram calculated using DETX and DETY for each event in the final _common_clean file
| Quadrant A |  |
 |
Quadrant B |
|---|---|---|---|
| Quadrant D |  |
 |
Quadrant C |
| Plot type | Count rate plots | Images |
|---|---|---|
| Comparison with Poisson distribution Blue bars denote a histogram of data divided into 1 sec bins. Red curve is a Poisson curve with rate = median count rate of data. |
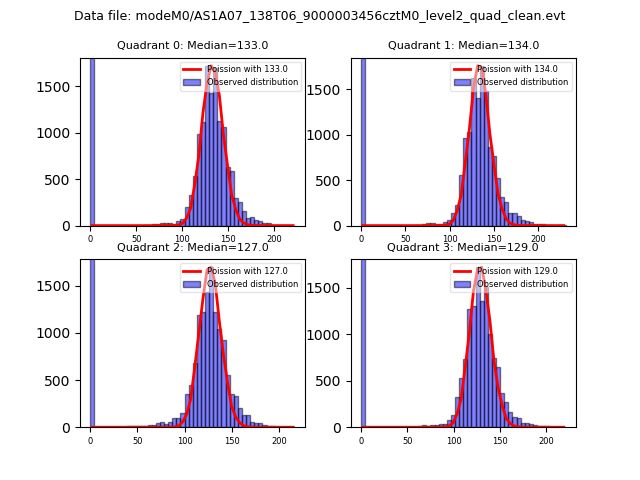 |
 |
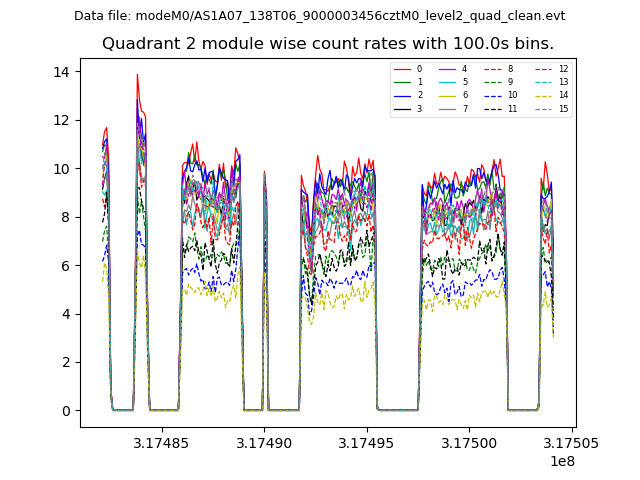
| Quadrant-wise count rates Data is divided into 100 sec bins |
 |
|
| Module-wise count rates for Quadrant A Data is divided into 100 sec bins |
 |
 |
| Module-wise count rates for Quadrant B Data is divided into 100 sec bins |
 |
 |
| Module-wise count rates for Quadrant C Data is divided into 100 sec bins |
 |
 |
| Module-wise count rates for Quadrant D Data is divided into 100 sec bins |
 |
 |
| Parameter | Plot |
|---|---|
| CZT HV Monitor |  |
| D_VDD |  |
| Temperature 1 |  |
| Veto HV Monitor |  |
| Veto LLD | 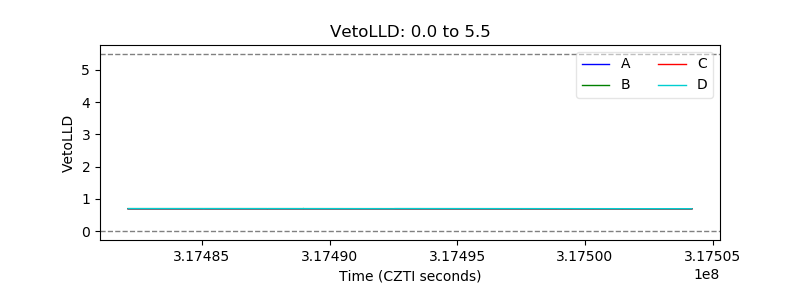 |
| Alpha Counter |  |
| _CPM_Rate |  |
| CZT Counter |  |
| +2.5 Volts monitor |  |
| +5 Volts monitor |  |
| _ROLL_ROT | 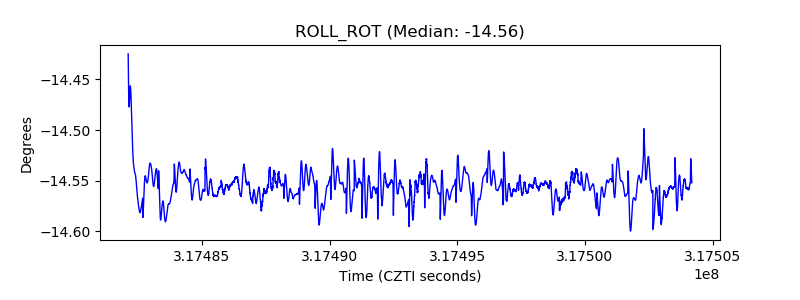 |
| _Roll_DEC |  |
| _Roll_RA |  |
| Veto Counter |  |