| Param | Original file | Final file |
|---|---|---|
| Filename | modeM0/AS1A07_135T01_9000003452cztM0_level2_bc.evt | modeM0/AS1A07_135T01_9000003452cztM0_level2_quad_clean.evt |
| Size (bytes) | 1,484,498,880 | 444,375,360 |
| Size | 1.4 GB | 423.8 MB |
| Events in quadrant A | 8,320,161 | 2,747,925 |
| Events in quadrant B | 9,060,874 | 2,782,681 |
| Events in quadrant C | 13,743,459 | 2,653,602 |
| Events in quadrant D | 11,214,069 | 2,636,834 |
| Mode SS | |||
|---|---|---|---|
| Quadrant | BADHDUFLAG | Total packets | Discarded packets |
| A | 0 | 784 | 0 |
| B | 0 | 784 | 0 |
| C | 0 | 784 | 0 |
| D | 0 | 784 | 0 |
| Mode M0 | |||
|---|---|---|---|
| Quadrant | BADHDUFLAG | Total packets | Discarded packets |
| A | 0 | 80357 | 0 |
| B | 0 | 83085 | 0 |
| C | 0 | 100489 | 0 |
| D | 0 | 89660 | 0 |
| Mode M9 | |||
|---|---|---|---|
| Quadrant | BADHDUFLAG | Total packets | Discarded packets |
| A | 0 | 67 | 0 |
| B | 0 | 67 | 0 |
| C | 0 | 67 | 0 |
| D | 0 | 67 | 0 |
| Quadrant | Total seconds | Saturated seconds | Saturation percentage |
|---|---|---|---|
| A | 38412 | 281 | 0.731542% |
| B | 38408 | 469 | 1.221100% |
| C | 38410 | 1081 | 2.814371% |
| D | 38415 | 526 | 1.369257% |
Noise dominated data is calculated using 1-second bins in cleaned event files. If a bin has >2000 counts, and if more than 50% of those come from <1% of pixels, then it is considered to be noise-dominated and hence unusable.
| Quadrant | # 1 sec bins | Bins with >0 counts | Bins with >2000 counts | High rate bins dominated by noise | Noise dominated (total time) | Noise dominated (detector-on time) | Marked lightcurve |
|---|---|---|---|---|---|---|---|
| A | 45149 | 38412 | 0 | 0 | 0.00% | 0.00% |  |
| B | 45149 | 38411 | 5 | 5 | 0.01% | 0.01% |  |
| C | 45149 | 38408 | 65 | 65 | 0.14% | 0.17% |  |
| D | 45149 | 38413 | 63 | 63 | 0.14% | 0.16% |  |
Top three noisy pixels from each quadrant. If the there are fewer than three noisy pixels in the level2.evt file, extra rows are filled as -1
| Pixel properties | Quadrant properties | ||||||
|---|---|---|---|---|---|---|---|
| Quadrant | DetID | PixID | Counts | Sigma | Mean | Median | Sigma |
| A | 13 | 254 | 52957 | 110.19 | 2152 | 2113 | 461.4 |
| A | 0 | 226 | 13996 | 25.75 | 2152 | 2113 | 461.4 |
| A | 12 | 194 | 13461 | 24.59 | 2152 | 2113 | 461.4 |
| B | 0 | 189 | 287547 | 716.05 | 2154 | 2107 | 398.6 |
| B | 0 | 190 | 169826 | 420.74 | 2154 | 2107 | 398.6 |
| B | 0 | 245 | 106415 | 261.67 | 2154 | 2107 | 398.6 |
| C | 0 | 239 | 5142357 | 10690.14 | 2066 | 2061 | 480.8 |
| C | 7 | 247 | 286224 | 590.97 | 2066 | 2061 | 480.8 |
| C | 10 | 9 | 223662 | 460.86 | 2066 | 2061 | 480.8 |
| D | 1 | 52 | 1368810 | 2783.24 | 2129 | 2057 | 491.1 |
| D | 9 | 85 | 474525 | 962.13 | 2129 | 2057 | 491.1 |
| D | 12 | 233 | 246279 | 497.33 | 2129 | 2057 | 491.1 |
Histogram calculated using DETX and DETY for each event in the final _common_clean file
| Quadrant A |  |
 |
Quadrant B |
|---|---|---|---|
| Quadrant D | 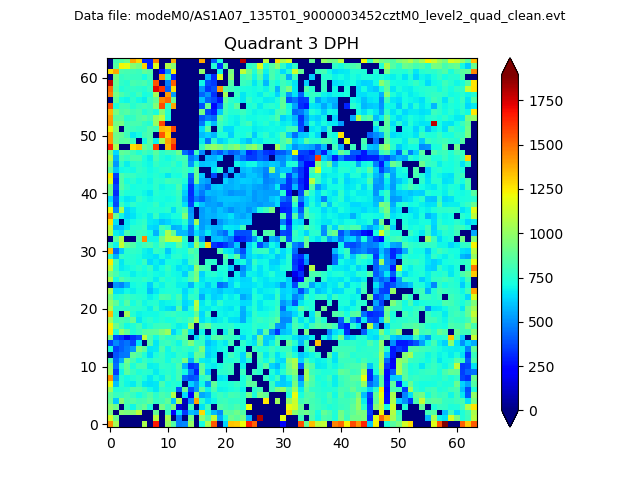 |
 |
Quadrant C |
| Plot type | Count rate plots | Images |
|---|---|---|
| Comparison with Poisson distribution Blue bars denote a histogram of data divided into 1 sec bins. Red curve is a Poisson curve with rate = median count rate of data. |
 |
 |
| Quadrant-wise count rates Data is divided into 100 sec bins |
 |
|
| Module-wise count rates for Quadrant A Data is divided into 100 sec bins |
 |
 |
| Module-wise count rates for Quadrant B Data is divided into 100 sec bins |
 |
 |
| Module-wise count rates for Quadrant C Data is divided into 100 sec bins |
 |
 |
| Module-wise count rates for Quadrant D Data is divided into 100 sec bins |
 |
 |
| Parameter | Plot |
|---|---|
| CZT HV Monitor |  |
| D_VDD |  |
| Temperature 1 |  |
| Veto HV Monitor |  |
| Veto LLD |  |
| Alpha Counter | 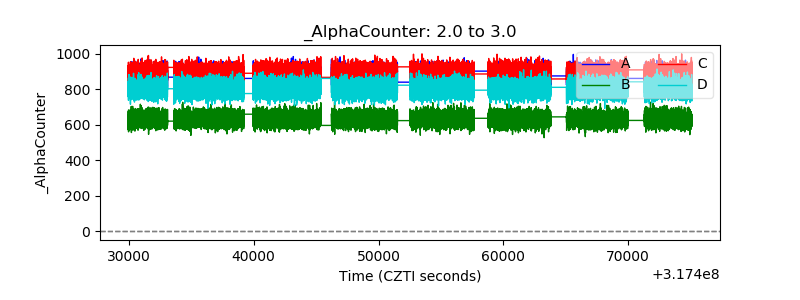 |
| _CPM_Rate | 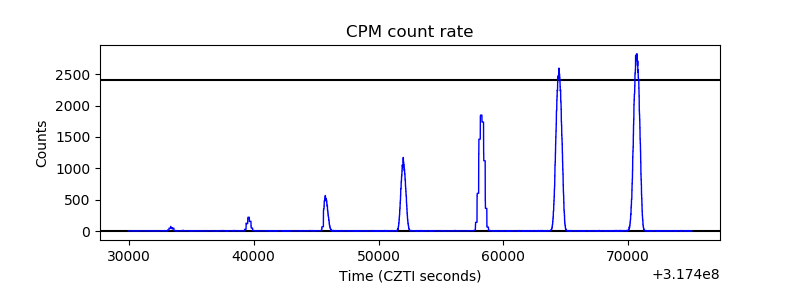 |
| CZT Counter | 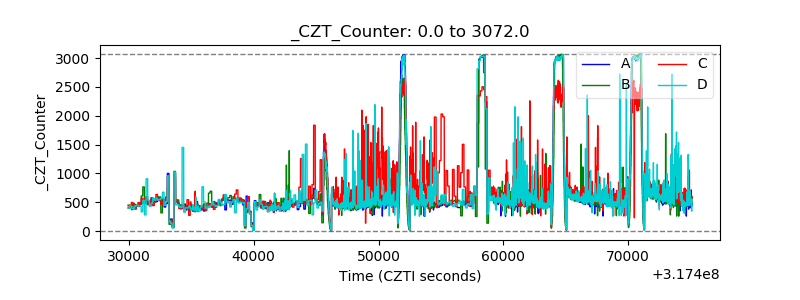 |
| +2.5 Volts monitor |  |
| +5 Volts monitor |  |
| _ROLL_ROT |  |
| _Roll_DEC |  |
| _Roll_RA |  |
| Veto Counter | 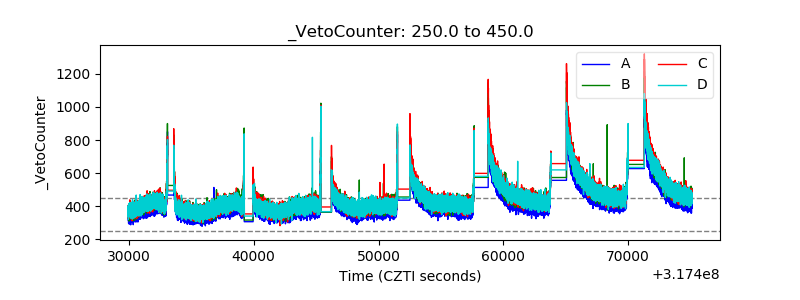 |