| Param | Original file | Final file |
|---|---|---|
| Filename | modeM0/AS1A07_135T02_9000003450cztM0_level2_bc.evt | modeM0/AS1A07_135T02_9000003450cztM0_level2_quad_clean.evt |
| Size (bytes) | 4,152,182,400 | 1,162,088,640 |
| Size | 3.9 GB | 1.1 GB |
| Events in quadrant A | 19,693,571 | 7,348,787 |
| Events in quadrant B | 20,484,558 | 7,463,124 |
| Events in quadrant C | 25,033,344 | 7,298,646 |
| Events in quadrant D | 54,315,534 | 6,821,389 |
| Mode M9 | |||
|---|---|---|---|
| Quadrant | BADHDUFLAG | Total packets | Discarded packets |
| A | 0 | 131 | 0 |
| B | 0 | 131 | 0 |
| C | 0 | 131 | 0 |
| D | 0 | 131 | 0 |
| Mode M0 | |||
|---|---|---|---|
| Quadrant | BADHDUFLAG | Total packets | Discarded packets |
| A | 0 | 191277 | 0 |
| B | 0 | 193502 | 0 |
| C | 0 | 209613 | 0 |
| D | 0 | 311610 | 0 |
| Mode SS | |||
|---|---|---|---|
| Quadrant | BADHDUFLAG | Total packets | Discarded packets |
| A | 0 | 1864 | 0 |
| B | 0 | 1866 | 0 |
| C | 0 | 1864 | 0 |
| D | 0 | 1868 | 0 |
| Quadrant | Total seconds | Saturated seconds | Saturation percentage |
|---|---|---|---|
| A | 91363 | 1097 | 1.200705% |
| B | 91324 | 1431 | 1.566948% |
| C | 91373 | 3358 | 3.675046% |
| D | 91281 | 14672 | 16.073444% |
Noise dominated data is calculated using 1-second bins in cleaned event files. If a bin has >2000 counts, and if more than 50% of those come from <1% of pixels, then it is considered to be noise-dominated and hence unusable.
| Quadrant | # 1 sec bins | Bins with >0 counts | Bins with >2000 counts | High rate bins dominated by noise | Noise dominated (total time) | Noise dominated (detector-on time) | Marked lightcurve |
|---|---|---|---|---|---|---|---|
| A | 111780 | 91778 | 29 | 29 | 0.03% | 0.03% |  |
| B | 111780 | 91722 | 159 | 159 | 0.14% | 0.17% |  |
| C | 111780 | 91780 | 507 | 507 | 0.45% | 0.55% |  |
| D | 111780 | 91671 | 2877 | 2877 | 2.57% | 3.14% |  |
Top three noisy pixels from each quadrant. If the there are fewer than three noisy pixels in the level2.evt file, extra rows are filled as -1
| Pixel properties | Quadrant properties | ||||||
|---|---|---|---|---|---|---|---|
| Quadrant | DetID | PixID | Counts | Sigma | Mean | Median | Sigma |
| A | 15 | 174 | 391462 | 361.72 | 4968 | 4873 | 1068.7 |
| A | 13 | 254 | 130537 | 117.58 | 4968 | 4873 | 1068.7 |
| A | 6 | 16 | 73865 | 64.55 | 4968 | 4873 | 1068.7 |
| B | 0 | 245 | 536723 | 570.74 | 4996 | 4878 | 931.9 |
| B | 0 | 190 | 202285 | 211.84 | 4996 | 4878 | 931.9 |
| B | 5 | 172 | 171977 | 179.32 | 4996 | 4878 | 931.9 |
| C | 0 | 239 | 5232393 | 4639.1 | 4825 | 4809 | 1126.9 |
| C | 10 | 9 | 523332 | 460.15 | 4825 | 4809 | 1126.9 |
| C | 7 | 247 | 366045 | 320.57 | 4825 | 4809 | 1126.9 |
| D | 7 | 223 | 21450011 | 19567.14 | 4704 | 4538 | 1096.0 |
| D | 1 | 52 | 10700475 | 9759.12 | 4704 | 4538 | 1096.0 |
| D | 12 | 227 | 815483 | 739.92 | 4704 | 4538 | 1096.0 |
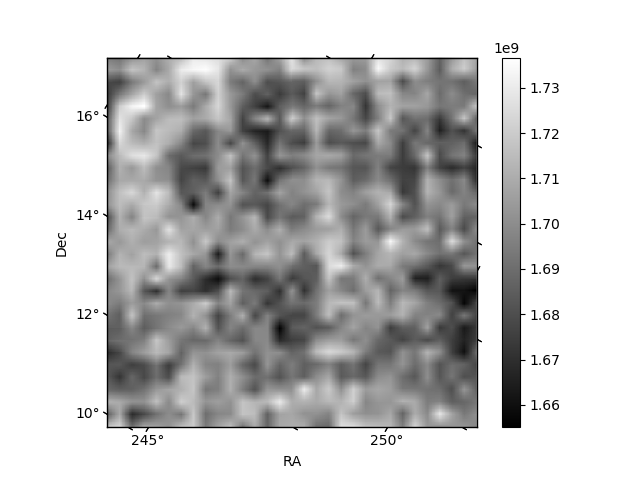
Histogram calculated using DETX and DETY for each event in the final _common_clean file
| Quadrant A | 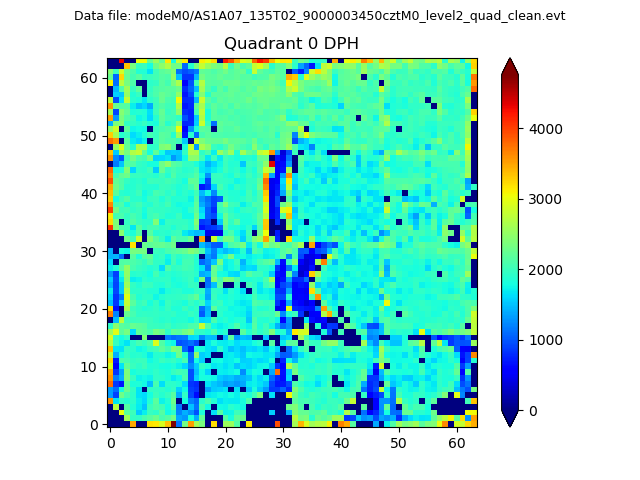 |
 |
Quadrant B |
|---|---|---|---|
| Quadrant D |  |
 |
Quadrant C |
| Plot type | Count rate plots | Images |
|---|---|---|
| Comparison with Poisson distribution Blue bars denote a histogram of data divided into 1 sec bins. Red curve is a Poisson curve with rate = median count rate of data. |
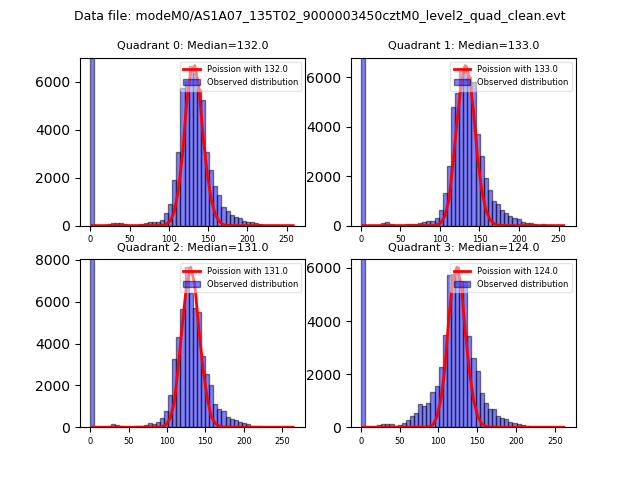 |
 |
| Quadrant-wise count rates Data is divided into 100 sec bins |
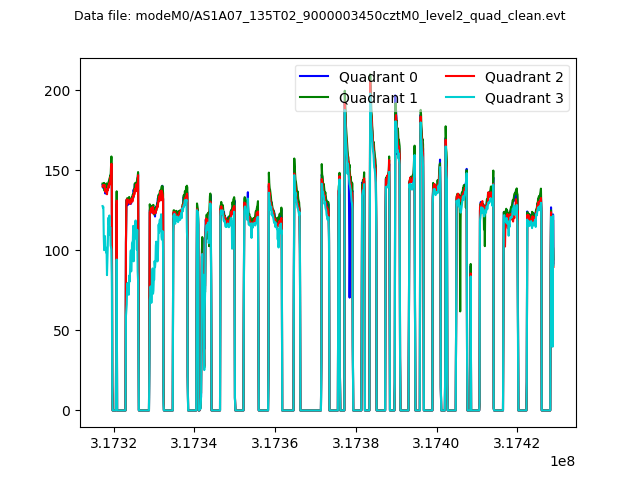 |
|
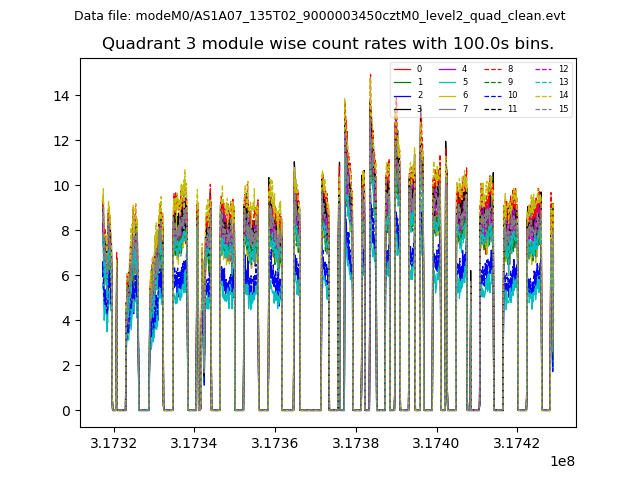
| Module-wise count rates for Quadrant A Data is divided into 100 sec bins |
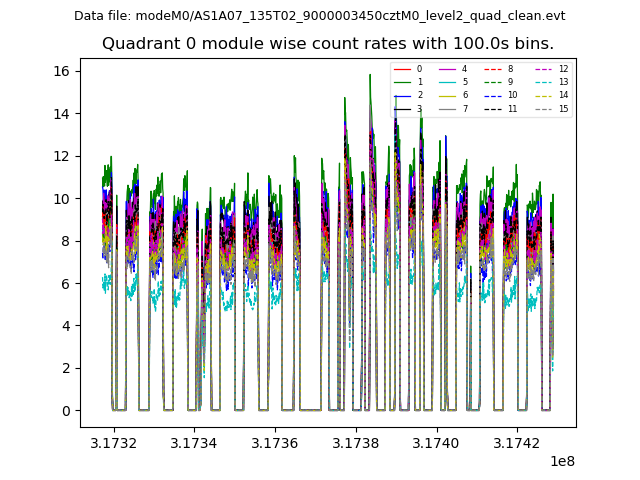 |
 |
| Module-wise count rates for Quadrant B Data is divided into 100 sec bins |
 |
 |
| Module-wise count rates for Quadrant C Data is divided into 100 sec bins |
 |
 |
| Module-wise count rates for Quadrant D Data is divided into 100 sec bins |
 |
 |
| Parameter | Plot |
|---|---|
| CZT HV Monitor |  |
| D_VDD |  |
| Temperature 1 | 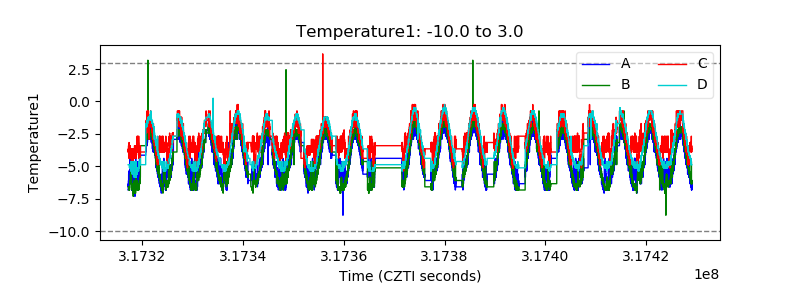 |
| Veto HV Monitor |  |
| Veto LLD | 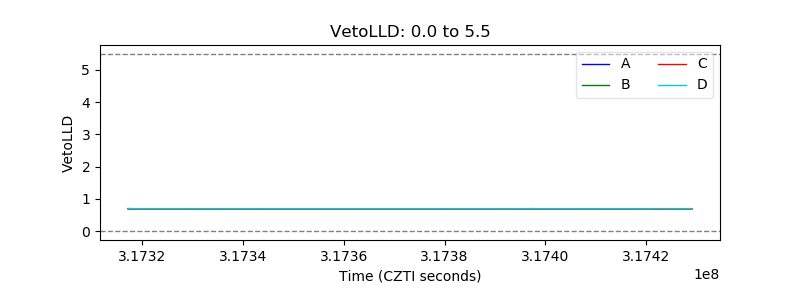 |
| Alpha Counter |  |
| _CPM_Rate |  |
| CZT Counter |  |
| +2.5 Volts monitor |  |
| +5 Volts monitor |  |
| _ROLL_ROT | 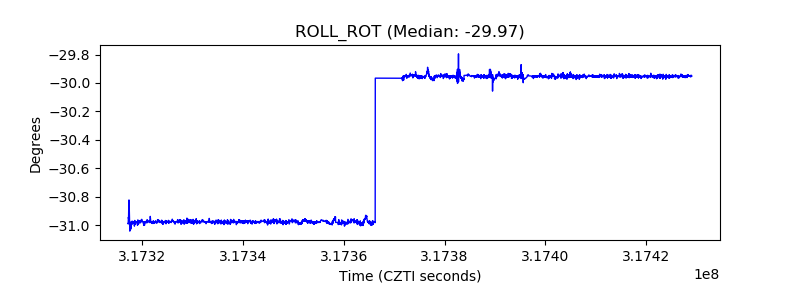 |
| _Roll_DEC |  |
| _Roll_RA |  |
| Veto Counter |  |