| Param | Original file | Final file |
|---|---|---|
| Filename | modeM0/AS1A07_148T05_9000003446cztM0_level2_bc.evt | modeM0/AS1A07_148T05_9000003446cztM0_level2_quad_clean.evt |
| Size (bytes) | 3,233,476,800 | 872,830,080 |
| Size | 3.0 GB | 832.4 MB |
| Events in quadrant A | 15,994,646 | 5,611,248 |
| Events in quadrant B | 14,989,548 | 5,687,691 |
| Events in quadrant C | 17,896,914 | 5,443,646 |
| Events in quadrant D | 44,452,272 | 5,066,152 |
| Mode M0 | |||
|---|---|---|---|
| Quadrant | BADHDUFLAG | Total packets | Discarded packets |
| A | 0 | 146620 | 0 |
| B | 0 | 143262 | 0 |
| C | 0 | 154683 | 0 |
| D | 0 | 241684 | 0 |
| Mode SS | |||
|---|---|---|---|
| Quadrant | BADHDUFLAG | Total packets | Discarded packets |
| A | 0 | 1372 | 0 |
| B | 0 | 1372 | 0 |
| C | 0 | 1372 | 0 |
| D | 0 | 1372 | 0 |
| Mode M9 | |||
|---|---|---|---|
| Quadrant | BADHDUFLAG | Total packets | Discarded packets |
| A | 0 | 107 | 0 |
| B | 0 | 107 | 0 |
| C | 0 | 107 | 0 |
| D | 0 | 107 | 0 |
| Quadrant | Total seconds | Saturated seconds | Saturation percentage |
|---|---|---|---|
| A | 67475 | 946 | 1.402001% |
| B | 67475 | 888 | 1.316043% |
| C | 67475 | 1626 | 2.409781% |
| D | 67475 | 11517 | 17.068544% |
Noise dominated data is calculated using 1-second bins in cleaned event files. If a bin has >2000 counts, and if more than 50% of those come from <1% of pixels, then it is considered to be noise-dominated and hence unusable.
| Quadrant | # 1 sec bins | Bins with >0 counts | Bins with >2000 counts | High rate bins dominated by noise | Noise dominated (total time) | Noise dominated (detector-on time) | Marked lightcurve |
|---|---|---|---|---|---|---|---|
| A | 82060 | 67472 | 155 | 155 | 0.19% | 0.23% |  |
| B | 82060 | 67468 | 20 | 20 | 0.02% | 0.03% |  |
| C | 82060 | 67469 | 126 | 126 | 0.15% | 0.19% | 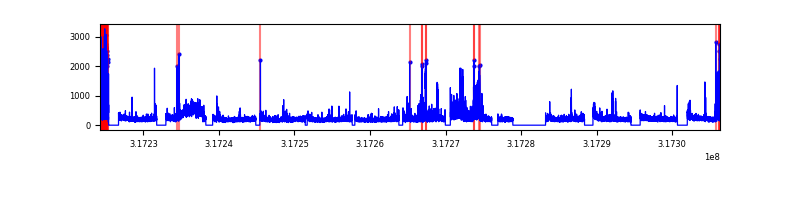 |
| D | 82060 | 67470 | 6062 | 6062 | 7.39% | 8.98% |  |
Top three noisy pixels from each quadrant. If the there are fewer than three noisy pixels in the level2.evt file, extra rows are filled as -1
| Pixel properties | Quadrant properties | ||||||
|---|---|---|---|---|---|---|---|
| Quadrant | DetID | PixID | Counts | Sigma | Mean | Median | Sigma |
| A | 6 | 16 | 1561256 | 1931.97 | 3731 | 3663 | 806.2 |
| A | 13 | 254 | 99298 | 118.62 | 3731 | 3663 | 806.2 |
| A | 2 | 79 | 45138 | 51.44 | 3731 | 3663 | 806.2 |
| B | 0 | 229 | 220227 | 310.78 | 3743 | 3659 | 696.9 |
| B | 0 | 190 | 116836 | 162.41 | 3743 | 3659 | 696.9 |
| B | 4 | 216 | 108035 | 149.78 | 3743 | 3659 | 696.9 |
| C | 10 | 9 | 3292309 | 3926.75 | 3587 | 3572 | 837.5 |
| C | 7 | 247 | 327747 | 387.06 | 3587 | 3572 | 837.5 |
| C | 0 | 207 | 269567 | 317.6 | 3587 | 3572 | 837.5 |
| D | 7 | 223 | 19469360 | 24544.38 | 3429 | 3315 | 793.1 |
| D | 1 | 52 | 8844877 | 11148.17 | 3429 | 3315 | 793.1 |
| D | 7 | 238 | 1513942 | 1904.72 | 3429 | 3315 | 793.1 |
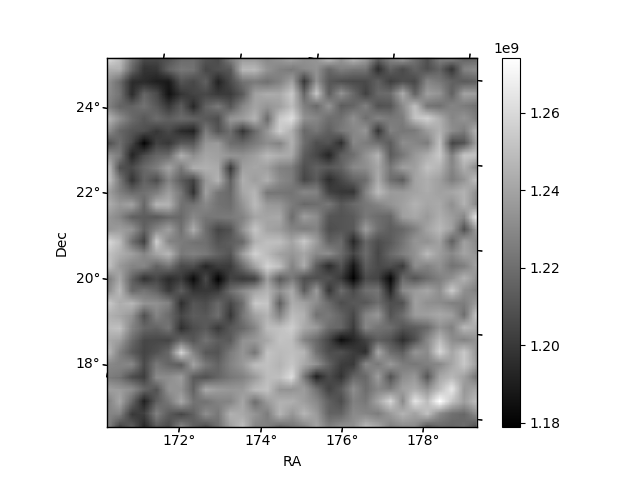
Histogram calculated using DETX and DETY for each event in the final _common_clean file
| Quadrant A |  |
 |
Quadrant B |
|---|---|---|---|
| Quadrant D | 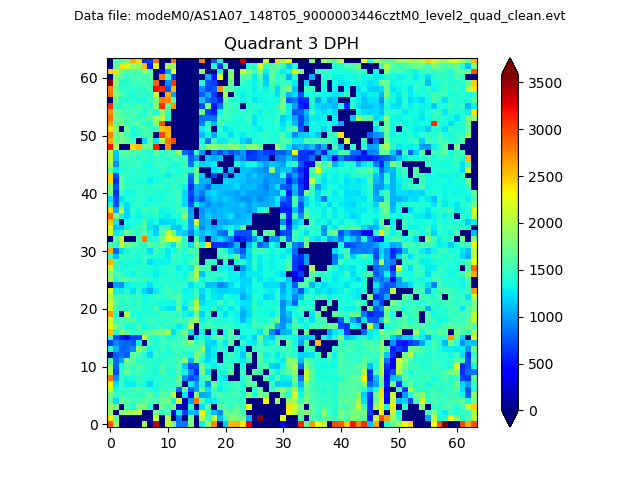 |
 |
Quadrant C |
| Plot type | Count rate plots | Images |
|---|---|---|
| Comparison with Poisson distribution Blue bars denote a histogram of data divided into 1 sec bins. Red curve is a Poisson curve with rate = median count rate of data. |
 |
 |
| Quadrant-wise count rates Data is divided into 100 sec bins |
 |
|
| Module-wise count rates for Quadrant A Data is divided into 100 sec bins |
 |
 |
| Module-wise count rates for Quadrant B Data is divided into 100 sec bins |
 |
 |
| Module-wise count rates for Quadrant C Data is divided into 100 sec bins |
 |
 |
| Module-wise count rates for Quadrant D Data is divided into 100 sec bins |
 |
 |
| Parameter | Plot |
|---|---|
| CZT HV Monitor | 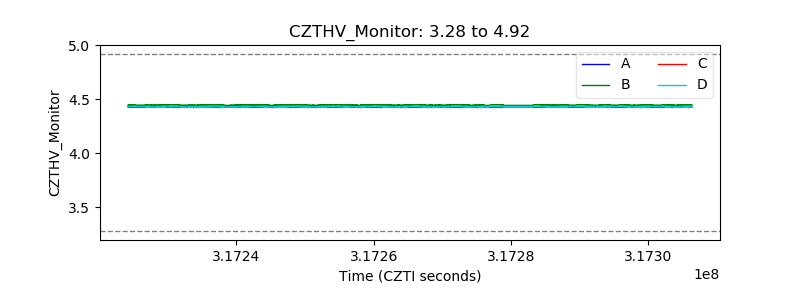 |
| D_VDD | 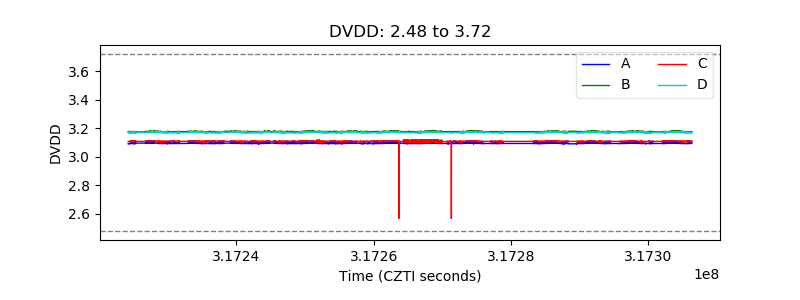 |
| Temperature 1 |  |
| Veto HV Monitor |  |
| Veto LLD |  |
| Alpha Counter |  |
| _CPM_Rate | 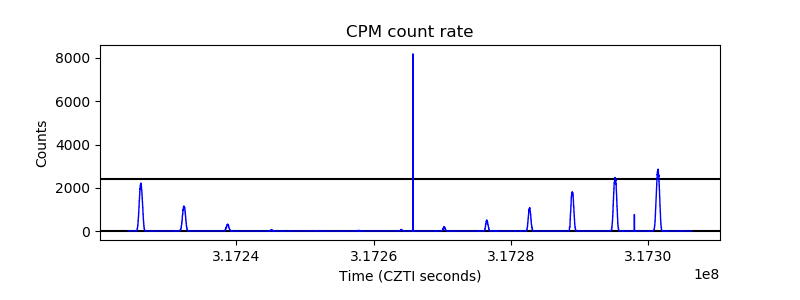 |
| CZT Counter | 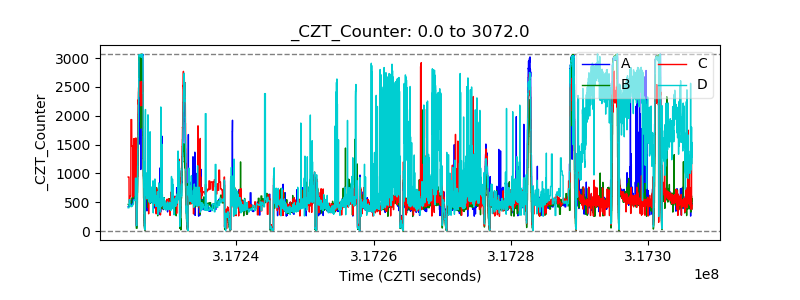 |
| +2.5 Volts monitor |  |
| +5 Volts monitor |  |
| _ROLL_ROT |  |
| _Roll_DEC | 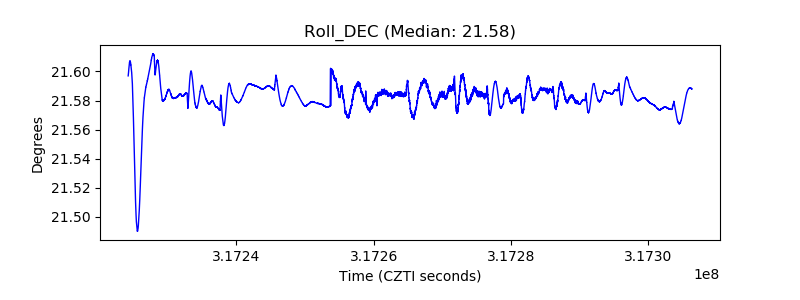 |
| _Roll_RA |  |
| Veto Counter |  |