| Param | Original file | Final file |
|---|---|---|
| Filename | modeM0/AS1A07_148T02_9000003444cztM0_level2_bc.evt | modeM0/AS1A07_148T02_9000003444cztM0_level2_quad_clean.evt |
| Size (bytes) | 3,398,947,200 | 1,118,240,640 |
| Size | 3.2 GB | 1.0 GB |
| Events in quadrant A | 20,187,810 | 7,079,025 |
| Events in quadrant B | 20,524,382 | 7,145,053 |
| Events in quadrant C | 21,464,458 | 6,866,433 |
| Events in quadrant D | 34,634,577 | 6,613,547 |
| Mode M9 | |||
|---|---|---|---|
| Quadrant | BADHDUFLAG | Total packets | Discarded packets |
| A | 0 | 163 | 0 |
| B | 0 | 163 | 0 |
| C | 0 | 163 | 0 |
| D | 0 | 163 | 0 |
| Mode SS | |||
|---|---|---|---|
| Quadrant | BADHDUFLAG | Total packets | Discarded packets |
| A | 0 | 1827 | 0 |
| B | 0 | 1828 | 0 |
| C | 0 | 1828 | 0 |
| D | 0 | 1828 | 0 |
| Mode M0 | |||
|---|---|---|---|
| Quadrant | BADHDUFLAG | Total packets | Discarded packets |
| A | 0 | 190963 | 0 |
| B | 0 | 191959 | 0 |
| C | 0 | 197328 | 0 |
| D | 0 | 243121 | 0 |
| Quadrant | Total seconds | Saturated seconds | Saturation percentage |
|---|---|---|---|
| A | 89975 | 1111 | 1.234787% |
| B | 89979 | 1226 | 1.362540% |
| C | 89978 | 2001 | 2.223877% |
| D | 89980 | 4034 | 4.483218% |
Noise dominated data is calculated using 1-second bins in cleaned event files. If a bin has >2000 counts, and if more than 50% of those come from <1% of pixels, then it is considered to be noise-dominated and hence unusable.
| Quadrant | # 1 sec bins | Bins with >0 counts | Bins with >2000 counts | High rate bins dominated by noise | Noise dominated (total time) | Noise dominated (detector-on time) | Marked lightcurve |
|---|---|---|---|---|---|---|---|
| A | 112755 | 89976 | 44 | 44 | 0.04% | 0.05% |  |
| B | 112755 | 89972 | 8 | 8 | 0.01% | 0.01% |  |
| C | 112755 | 89975 | 211 | 211 | 0.19% | 0.23% |  |
| D | 112755 | 89975 | 599 | 599 | 0.53% | 0.67% |  |
Top three noisy pixels from each quadrant. If the there are fewer than three noisy pixels in the level2.evt file, extra rows are filled as -1
| Pixel properties | Quadrant properties | ||||||
|---|---|---|---|---|---|---|---|
| Quadrant | DetID | PixID | Counts | Sigma | Mean | Median | Sigma |
| A | 6 | 16 | 535934 | 487.19 | 5093 | 5004 | 1089.8 |
| A | 13 | 254 | 136689 | 120.84 | 5093 | 5004 | 1089.8 |
| A | 0 | 226 | 33329 | 25.99 | 5093 | 5004 | 1089.8 |
| B | 0 | 229 | 296610 | 311.0 | 5092 | 4980 | 937.7 |
| B | 0 | 190 | 230657 | 240.66 | 5092 | 4980 | 937.7 |
| B | 0 | 230 | 192797 | 200.29 | 5092 | 4980 | 937.7 |
| C | 10 | 9 | 1406413 | 1231.35 | 4888 | 4875 | 1138.2 |
| C | 0 | 10 | 708172 | 617.9 | 4888 | 4875 | 1138.2 |
| C | 7 | 247 | 251768 | 216.91 | 4888 | 4875 | 1138.2 |
| D | 1 | 52 | 8356437 | 7414.05 | 4935 | 4771 | 1126.5 |
| D | 7 | 238 | 5146352 | 4564.35 | 4935 | 4771 | 1126.5 |
| D | 1 | 239 | 880830 | 777.71 | 4935 | 4771 | 1126.5 |
Histogram calculated using DETX and DETY for each event in the final _common_clean file
| Quadrant A |  |
 |
Quadrant B |
|---|---|---|---|
| Quadrant D |  |
 |
Quadrant C |
| Plot type | Count rate plots | Images |
|---|---|---|
| Comparison with Poisson distribution Blue bars denote a histogram of data divided into 1 sec bins. Red curve is a Poisson curve with rate = median count rate of data. |
 |
 |
| Quadrant-wise count rates Data is divided into 100 sec bins |
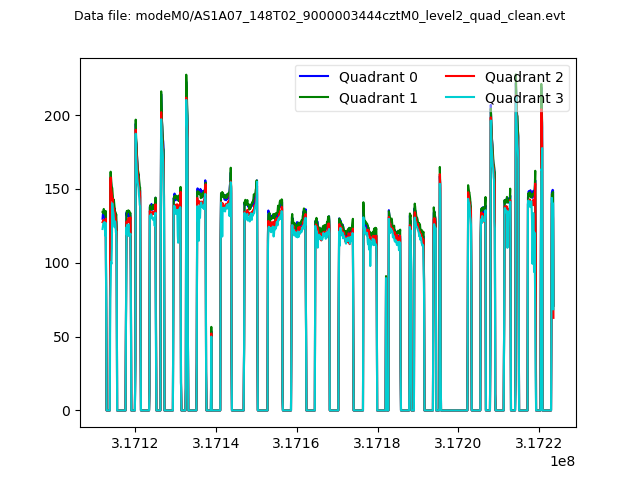 |
|
| Module-wise count rates for Quadrant A Data is divided into 100 sec bins |
 |
 |
| Module-wise count rates for Quadrant B Data is divided into 100 sec bins |
 |
 |
| Module-wise count rates for Quadrant C Data is divided into 100 sec bins |
 |
 |
| Module-wise count rates for Quadrant D Data is divided into 100 sec bins |
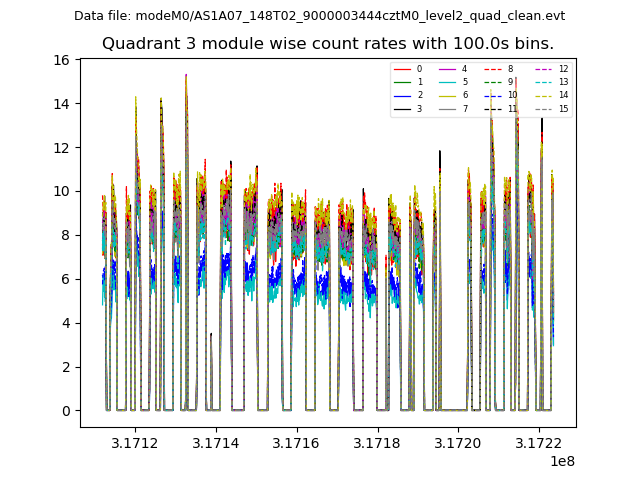 |
 |
| Parameter | Plot |
|---|---|
| CZT HV Monitor |  |
| D_VDD |  |
| Temperature 1 | 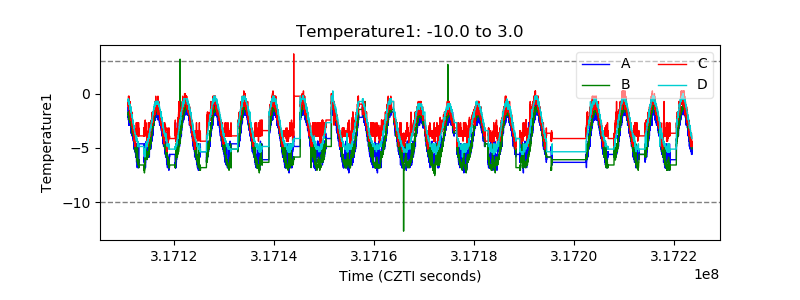 |
| Veto HV Monitor |  |
| Veto LLD | 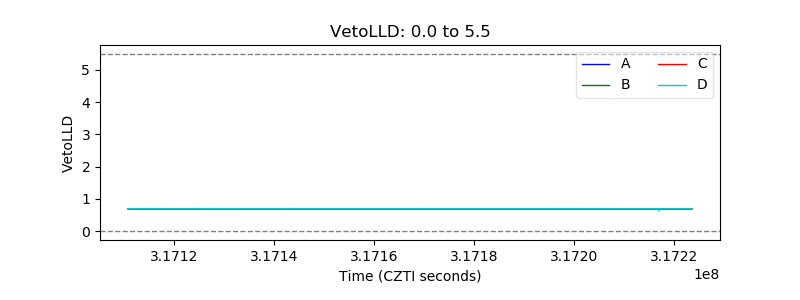 |
| Alpha Counter |  |
| _CPM_Rate |  |
| CZT Counter |  |
| +2.5 Volts monitor |  |
| +5 Volts monitor |  |
| _ROLL_ROT |  |
| _Roll_DEC |  |
| _Roll_RA |  |
| Veto Counter |  |