| Param | Original file | Final file |
|---|---|---|
| Filename | modeM0/AS1C05_012T03_9000003442cztM0_level2_bc.evt | modeM0/AS1C05_012T03_9000003442cztM0_level2_quad_clean.evt |
| Size (bytes) | 2,943,619,200 | 1,504,995,840 |
| Size | 2.7 GB | 1.4 GB |
| Events in quadrant A | 16,048,683 | 10,308,385 |
| Events in quadrant B | 16,700,622 | 10,411,264 |
| Events in quadrant C | 17,013,012 | 9,991,123 |
| Events in quadrant D | 34,084,421 | 9,544,042 |
| Mode M9 | |||
|---|---|---|---|
| Quadrant | BADHDUFLAG | Total packets | Discarded packets |
| A | 0 | 135 | 0 |
| B | 0 | 135 | 0 |
| C | 0 | 135 | 0 |
| D | 0 | 135 | 0 |
| Mode SS | |||
|---|---|---|---|
| Quadrant | BADHDUFLAG | Total packets | Discarded packets |
| A | 0 | 1582 | 0 |
| B | 0 | 1582 | 0 |
| C | 0 | 1582 | 0 |
| D | 0 | 1582 | 0 |
| Mode M0 | |||
|---|---|---|---|
| Quadrant | BADHDUFLAG | Total packets | Discarded packets |
| A | 0 | 159954 | 0 |
| B | 0 | 161807 | 0 |
| C | 0 | 164013 | 0 |
| D | 0 | 221206 | 0 |
| Quadrant | Total seconds | Saturated seconds | Saturation percentage |
|---|---|---|---|
| A | 77833 | 546 | 0.701502% |
| B | 77833 | 793 | 1.018848% |
| C | 77834 | 1067 | 1.370866% |
| D | 77834 | 4701 | 6.039777% |
Noise dominated data is calculated using 1-second bins in cleaned event files. If a bin has >2000 counts, and if more than 50% of those come from <1% of pixels, then it is considered to be noise-dominated and hence unusable.
| Quadrant | # 1 sec bins | Bins with >0 counts | Bins with >2000 counts | High rate bins dominated by noise | Noise dominated (total time) | Noise dominated (detector-on time) | Marked lightcurve |
|---|---|---|---|---|---|---|---|
| A | 91069 | 77830 | 2 | 2 | 0.00% | 0.00% |  |
| B | 91069 | 77828 | 43 | 43 | 0.05% | 0.06% |  |
| C | 91069 | 77834 | 34 | 34 | 0.04% | 0.04% | 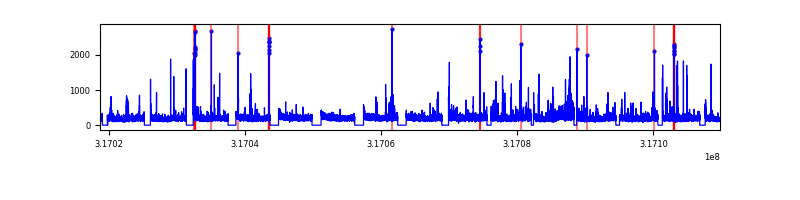 |
| D | 91069 | 77825 | 1067 | 1067 | 1.17% | 1.37% |  |
Top three noisy pixels from each quadrant. If the there are fewer than three noisy pixels in the level2.evt file, extra rows are filled as -1
| Pixel properties | Quadrant properties | ||||||
|---|---|---|---|---|---|---|---|
| Quadrant | DetID | PixID | Counts | Sigma | Mean | Median | Sigma |
| A | 13 | 254 | 113304 | 121.97 | 4134 | 4070 | 895.6 |
| A | 6 | 16 | 73684 | 77.73 | 4134 | 4070 | 895.6 |
| A | 0 | 226 | 26773 | 25.35 | 4134 | 4070 | 895.6 |
| B | 5 | 172 | 235180 | 295.07 | 4144 | 4048 | 783.3 |
| B | 0 | 229 | 200188 | 250.4 | 4144 | 4048 | 783.3 |
| B | 14 | 207 | 162133 | 201.81 | 4144 | 4048 | 783.3 |
| C | 10 | 9 | 902489 | 950.73 | 3987 | 3970 | 945.1 |
| C | 7 | 247 | 364533 | 381.52 | 3987 | 3970 | 945.1 |
| C | 0 | 239 | 177943 | 184.08 | 3987 | 3970 | 945.1 |
| D | 1 | 52 | 11706266 | 12370.51 | 3993 | 3863 | 946.0 |
| D | 7 | 238 | 4815936 | 5086.8 | 3993 | 3863 | 946.0 |
| D | 12 | 233 | 739989 | 778.15 | 3993 | 3863 | 946.0 |
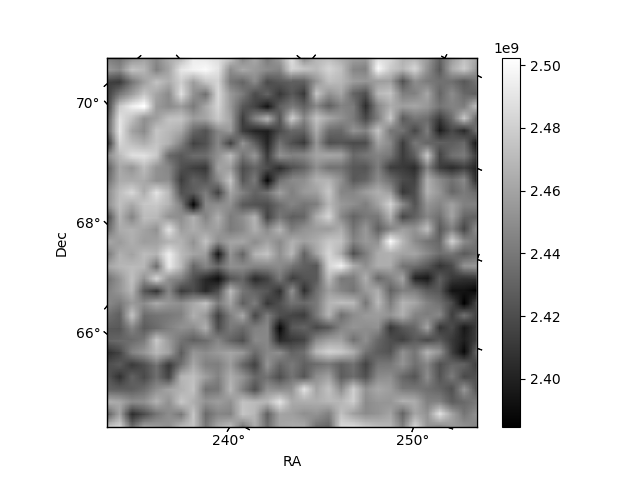
Histogram calculated using DETX and DETY for each event in the final _common_clean file
| Quadrant A |  |
 |
Quadrant B |
|---|---|---|---|
| Quadrant D |  |
 |
Quadrant C |
| Plot type | Count rate plots | Images |
|---|---|---|
| Comparison with Poisson distribution Blue bars denote a histogram of data divided into 1 sec bins. Red curve is a Poisson curve with rate = median count rate of data. |
 |
 |
| Quadrant-wise count rates Data is divided into 100 sec bins |
 |
|
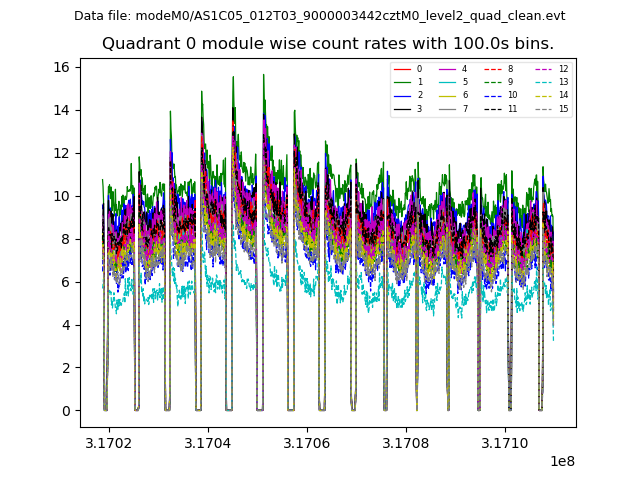
| Module-wise count rates for Quadrant A Data is divided into 100 sec bins |
 |
 |
| Module-wise count rates for Quadrant B Data is divided into 100 sec bins |
 |
 |
| Module-wise count rates for Quadrant C Data is divided into 100 sec bins |
 |
 |
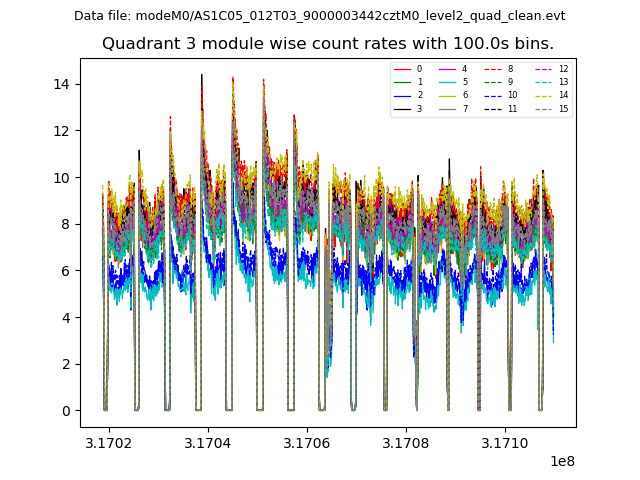
| Module-wise count rates for Quadrant D Data is divided into 100 sec bins |
 |
 |
| Parameter | Plot |
|---|---|
| CZT HV Monitor | 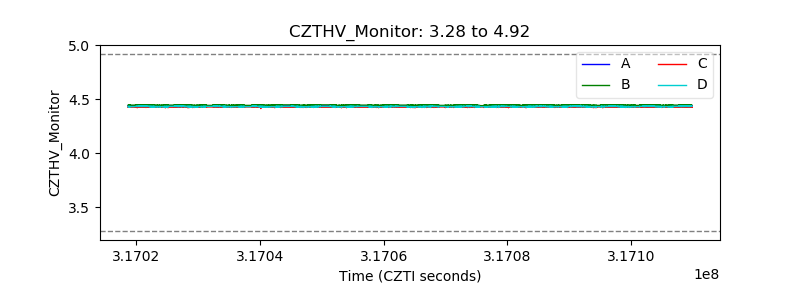 |
| D_VDD | 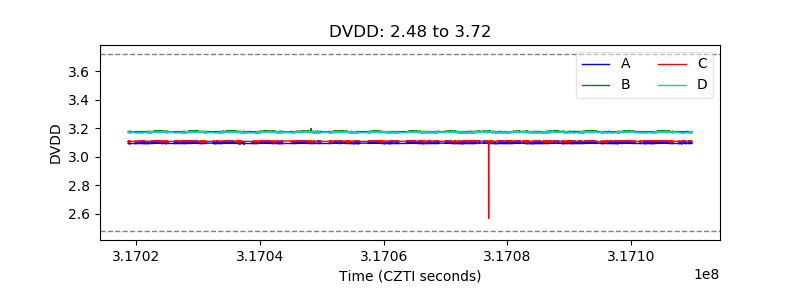 |
| Temperature 1 |  |
| Veto HV Monitor |  |
| Veto LLD | 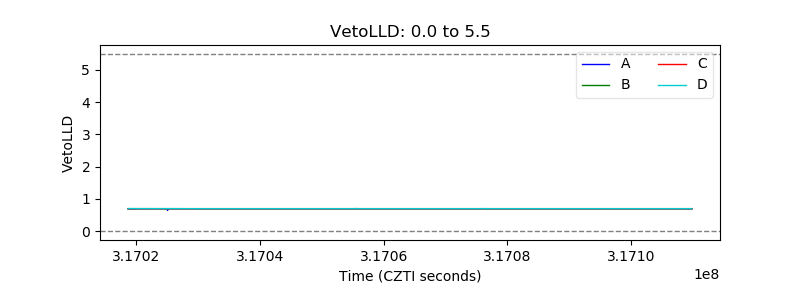 |
| Alpha Counter |  |
| _CPM_Rate |  |
| CZT Counter |  |
| +2.5 Volts monitor |  |
| +5 Volts monitor | 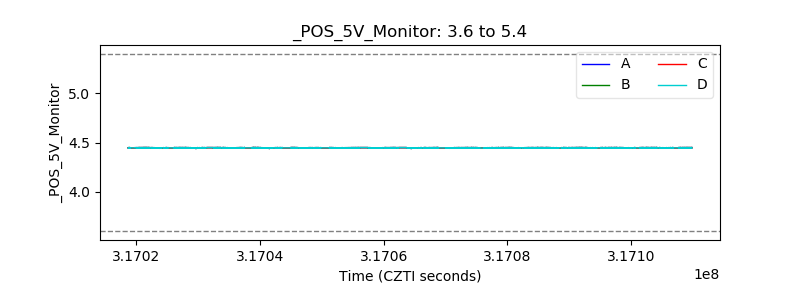 |
| _ROLL_ROT |  |
| _Roll_DEC |  |
| _Roll_RA |  |
| Veto Counter |  |