| Param | Original file | Final file |
|---|---|---|
| Filename | modeM0/AS1A08_004T03_9000003438cztM0_level2_bc.evt | modeM0/AS1A08_004T03_9000003438cztM0_level2_quad_clean.evt |
| Size (bytes) | 4,724,308,800 | 1,734,105,600 |
| Size | 4.4 GB | 1.6 GB |
| Events in quadrant A | 28,026,697 | 11,102,210 |
| Events in quadrant B | 28,931,946 | 11,253,012 |
| Events in quadrant C | 31,464,111 | 10,588,807 |
| Events in quadrant D | 45,474,297 | 10,346,936 |
| Mode M9 | |||
|---|---|---|---|
| Quadrant | BADHDUFLAG | Total packets | Discarded packets |
| A | 0 | 219 | 0 |
| B | 0 | 218 | 0 |
| C | 0 | 219 | 0 |
| D | 0 | 219 | 0 |
| Mode M0 | |||
|---|---|---|---|
| Quadrant | BADHDUFLAG | Total packets | Discarded packets |
| A | 0 | 278755 | 0 |
| B | 0 | 281326 | 0 |
| C | 0 | 293877 | 0 |
| D | 0 | 338517 | 0 |
| Mode SS | |||
|---|---|---|---|
| Quadrant | BADHDUFLAG | Total packets | Discarded packets |
| A | 0 | 2736 | 0 |
| B | 0 | 2740 | 0 |
| C | 0 | 2736 | 0 |
| D | 0 | 2738 | 0 |
| Quadrant | Total seconds | Saturated seconds | Saturation percentage |
|---|---|---|---|
| A | 134807 | 1228 | 0.910932% |
| B | 134804 | 1597 | 1.184683% |
| C | 134813 | 2812 | 2.085852% |
| D | 134795 | 4211 | 3.124003% |
Noise dominated data is calculated using 1-second bins in cleaned event files. If a bin has >2000 counts, and if more than 50% of those come from <1% of pixels, then it is considered to be noise-dominated and hence unusable.
| Quadrant | # 1 sec bins | Bins with >0 counts | Bins with >2000 counts | High rate bins dominated by noise | Noise dominated (total time) | Noise dominated (detector-on time) | Marked lightcurve |
|---|---|---|---|---|---|---|---|
| A | 156783 | 134848 | 4 | 4 | 0.00% | 0.00% |  |
| B | 156783 | 134827 | 19 | 19 | 0.01% | 0.01% |  |
| C | 156783 | 134843 | 219 | 219 | 0.14% | 0.16% |  |
| D | 156783 | 134810 | 733 | 733 | 0.47% | 0.54% |  |
Top three noisy pixels from each quadrant. If the there are fewer than three noisy pixels in the level2.evt file, extra rows are filled as -1
| Pixel properties | Quadrant properties | ||||||
|---|---|---|---|---|---|---|---|
| Quadrant | DetID | PixID | Counts | Sigma | Mean | Median | Sigma |
| A | 6 | 16 | 222839 | 138.83 | 7189 | 7056 | 1554.3 |
| A | 13 | 254 | 195650 | 121.34 | 7189 | 7056 | 1554.3 |
| A | 0 | 226 | 46121 | 25.13 | 7189 | 7056 | 1554.3 |
| B | 3 | 64 | 300830 | 215.93 | 7252 | 7075 | 1360.4 |
| B | 0 | 229 | 178751 | 126.19 | 7252 | 7075 | 1360.4 |
| B | 0 | 190 | 150772 | 105.63 | 7252 | 7075 | 1360.4 |
| C | 10 | 9 | 2466182 | 1530.62 | 6863 | 6841 | 1606.8 |
| C | 0 | 207 | 801899 | 494.82 | 6863 | 6841 | 1606.8 |
| C | 0 | 239 | 648345 | 399.25 | 6863 | 6841 | 1606.8 |
| D | 1 | 52 | 11258095 | 6929.84 | 7010 | 6770 | 1623.6 |
| D | 7 | 238 | 1977669 | 1213.9 | 7010 | 6770 | 1623.6 |
| D | 2 | 152 | 1327499 | 813.45 | 7010 | 6770 | 1623.6 |
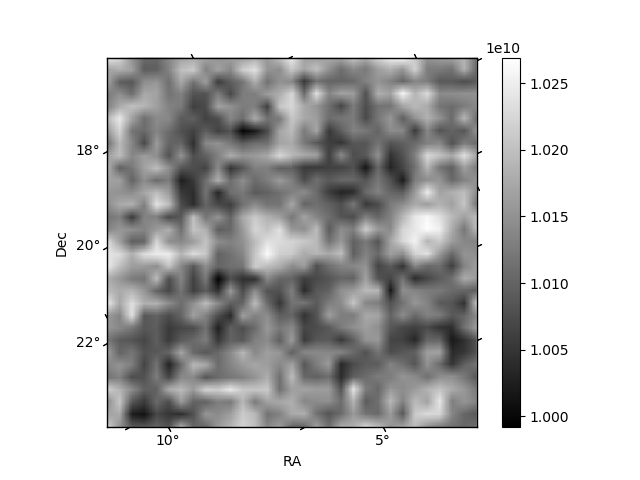
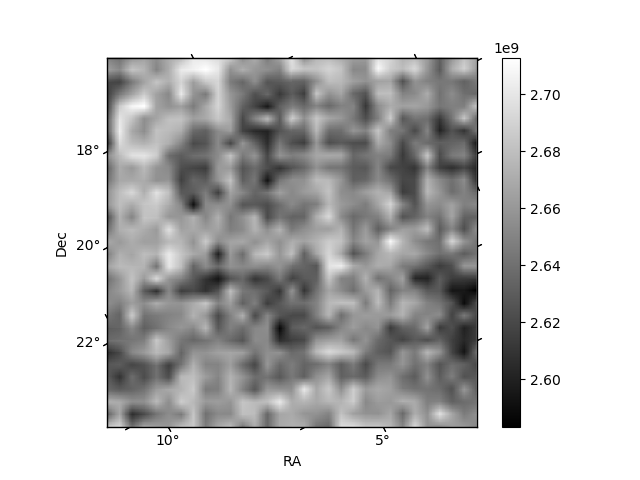
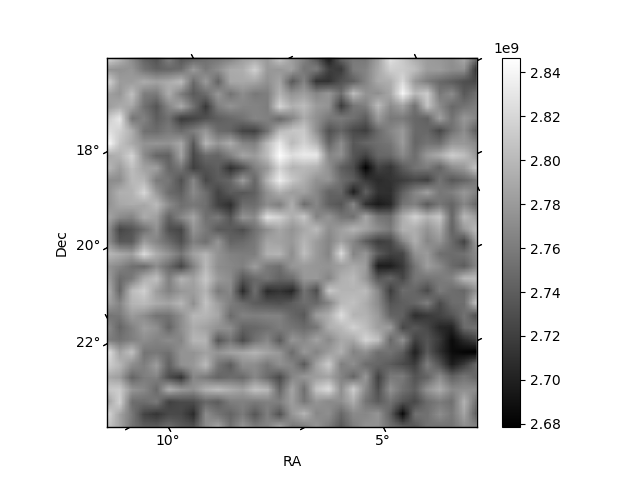
Histogram calculated using DETX and DETY for each event in the final _common_clean file
| Quadrant A |  |
 |
Quadrant B |
|---|---|---|---|
| Quadrant D |  |
 |
Quadrant C |
| Plot type | Count rate plots | Images |
|---|---|---|
| Comparison with Poisson distribution Blue bars denote a histogram of data divided into 1 sec bins. Red curve is a Poisson curve with rate = median count rate of data. |
 |
 |
| Quadrant-wise count rates Data is divided into 100 sec bins |
 |
|
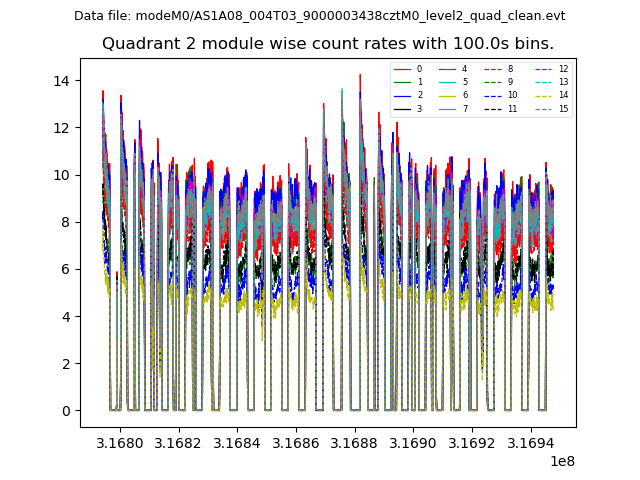
| Module-wise count rates for Quadrant A Data is divided into 100 sec bins |
 |
 |
| Module-wise count rates for Quadrant B Data is divided into 100 sec bins |
 |
 |
| Module-wise count rates for Quadrant C Data is divided into 100 sec bins |
 |
 |
| Module-wise count rates for Quadrant D Data is divided into 100 sec bins |
 |
 |
| Parameter | Plot |
|---|---|
| CZT HV Monitor | 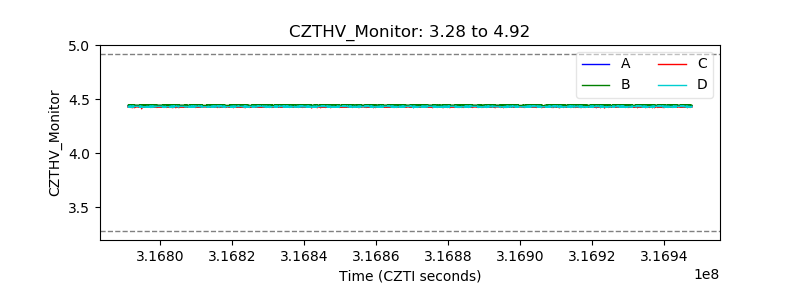 |
| D_VDD |  |
| Temperature 1 |  |
| Veto HV Monitor |  |
| Veto LLD | 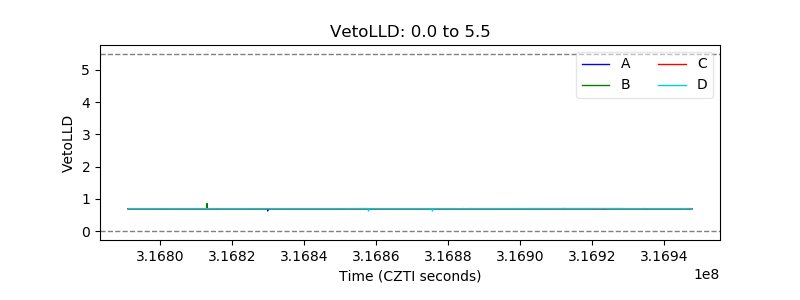 |
| Alpha Counter |  |
| _CPM_Rate |  |
| CZT Counter | 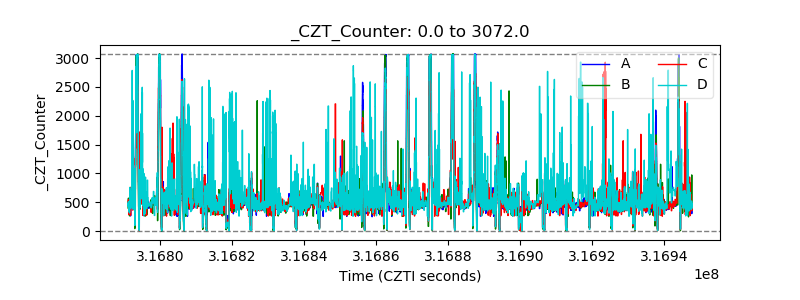 |
| +2.5 Volts monitor | 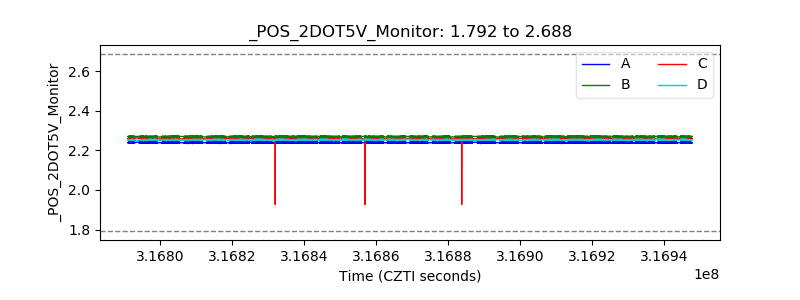 |
| +5 Volts monitor |  |
| _ROLL_ROT |  |
| _Roll_DEC |  |
| _Roll_RA |  |
| Veto Counter |  |