| Param | Original file | Final file |
|---|---|---|
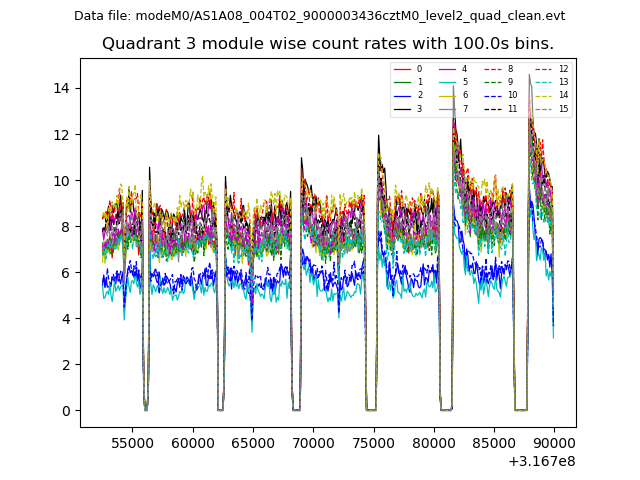
| Filename | modeM0/AS1A08_004T02_9000003436cztM0_level2_bc.evt | modeM0/AS1A08_004T02_9000003436cztM0_level2_quad_clean.evt |
| Size (bytes) | 1,211,169,600 | 623,776,320 |
| Size | 1.1 GB | 594.9 MB |
| Events in quadrant A | 6,878,497 | 4,257,071 |
| Events in quadrant B | 7,000,805 | 4,322,229 |
| Events in quadrant C | 9,511,755 | 4,077,558 |
| Events in quadrant D | 11,079,452 | 4,014,328 |
| Mode SS | |||
|---|---|---|---|
| Quadrant | BADHDUFLAG | Total packets | Discarded packets |
| A | 0 | 656 | 0 |
| B | 0 | 656 | 0 |
| C | 0 | 656 | 0 |
| D | 0 | 656 | 0 |
| Mode M0 | |||
|---|---|---|---|
| Quadrant | BADHDUFLAG | Total packets | Discarded packets |
| A | 0 | 67269 | 0 |
| B | 0 | 67676 | 0 |
| C | 0 | 76627 | 0 |
| D | 0 | 80195 | 0 |
| Mode M9 | |||
|---|---|---|---|
| Quadrant | BADHDUFLAG | Total packets | Discarded packets |
| A | 0 | 52 | 0 |
| B | 0 | 52 | 0 |
| C | 0 | 52 | 0 |
| D | 0 | 52 | 0 |
| Quadrant | Total seconds | Saturated seconds | Saturation percentage |
|---|---|---|---|
| A | 32383 | 300 | 0.926412% |
| B | 32383 | 410 | 1.266096% |
| C | 32383 | 1053 | 3.251706% |
| D | 32383 | 882 | 2.723651% |
Noise dominated data is calculated using 1-second bins in cleaned event files. If a bin has >2000 counts, and if more than 50% of those come from <1% of pixels, then it is considered to be noise-dominated and hence unusable.
| Quadrant | # 1 sec bins | Bins with >0 counts | Bins with >2000 counts | High rate bins dominated by noise | Noise dominated (total time) | Noise dominated (detector-on time) | Marked lightcurve |
|---|---|---|---|---|---|---|---|
| A | 37463 | 32380 | 0 | 0 | 0.00% | 0.00% |  |
| B | 37463 | 32377 | 9 | 9 | 0.02% | 0.03% |  |
| C | 37463 | 32377 | 62 | 62 | 0.17% | 0.19% | 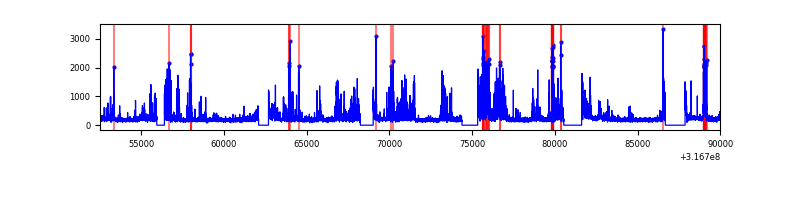 |
| D | 37463 | 32379 | 102 | 102 | 0.27% | 0.32% |  |
Top three noisy pixels from each quadrant. If the there are fewer than three noisy pixels in the level2.evt file, extra rows are filled as -1
| Pixel properties | Quadrant properties | ||||||
|---|---|---|---|---|---|---|---|
| Quadrant | DetID | PixID | Counts | Sigma | Mean | Median | Sigma |
| A | 13 | 252 | 142333 | 376.46 | 1715 | 1685 | 373.6 |
| A | 6 | 16 | 102614 | 270.15 | 1715 | 1685 | 373.6 |
| A | 13 | 254 | 47285 | 122.05 | 1715 | 1685 | 373.6 |
| B | 0 | 228 | 71639 | 214.34 | 1727 | 1687 | 326.4 |
| B | 3 | 64 | 57928 | 172.33 | 1727 | 1687 | 326.4 |
| B | 0 | 229 | 45297 | 133.62 | 1727 | 1687 | 326.4 |
| C | 8 | 208 | 2431106 | 6277.97 | 1633 | 1629 | 387.0 |
| C | 3 | 233 | 319459 | 821.3 | 1633 | 1629 | 387.0 |
| C | 0 | 10 | 259037 | 665.16 | 1633 | 1629 | 387.0 |
| D | 7 | 238 | 966814 | 2448.39 | 1674 | 1620 | 394.2 |
| D | 12 | 218 | 880100 | 2228.42 | 1674 | 1620 | 394.2 |
| D | 1 | 52 | 801927 | 2030.12 | 1674 | 1620 | 394.2 |
Histogram calculated using DETX and DETY for each event in the final _common_clean file
| Quadrant A |  |
 |
Quadrant B |
|---|---|---|---|
| Quadrant D | 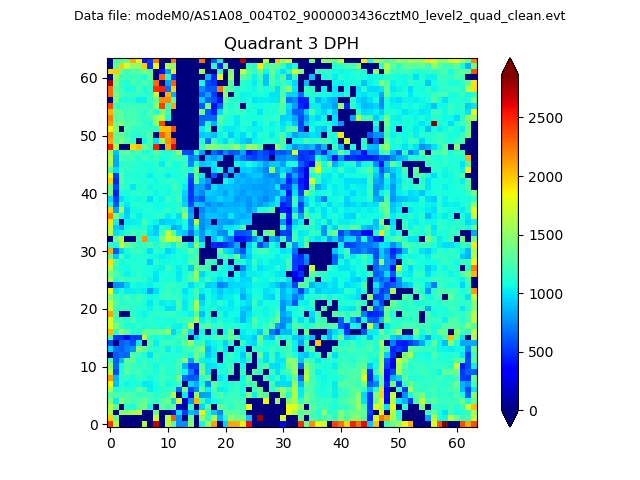 |
 |
Quadrant C |
| Plot type | Count rate plots | Images |
|---|---|---|
| Comparison with Poisson distribution Blue bars denote a histogram of data divided into 1 sec bins. Red curve is a Poisson curve with rate = median count rate of data. |
 |
 |
| Quadrant-wise count rates Data is divided into 100 sec bins |
 |
|
| Module-wise count rates for Quadrant A Data is divided into 100 sec bins |
 |
 |
| Module-wise count rates for Quadrant B Data is divided into 100 sec bins |
 |
 |
| Module-wise count rates for Quadrant C Data is divided into 100 sec bins |
 |
 |
| Module-wise count rates for Quadrant D Data is divided into 100 sec bins |
 |
 |
| Parameter | Plot |
|---|---|
| CZT HV Monitor |  |
| D_VDD |  |
| Temperature 1 |  |
| Veto HV Monitor | 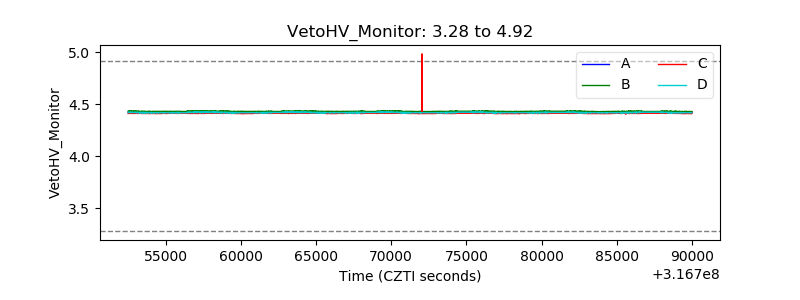 |
| Veto LLD |  |
| Alpha Counter |  |
| _CPM_Rate |  |
| CZT Counter |  |
| +2.5 Volts monitor |  |
| +5 Volts monitor |  |
| _ROLL_ROT |  |
| _Roll_DEC | 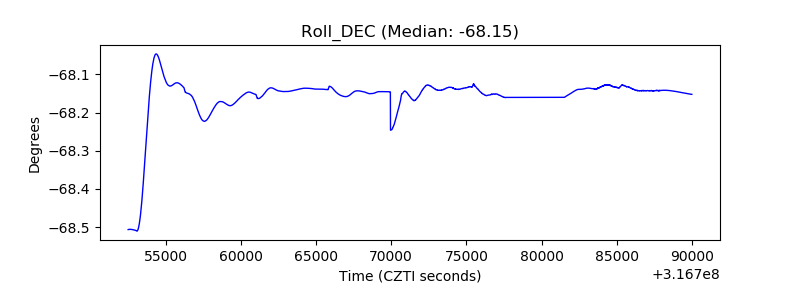 |
| _Roll_RA |  |
| Veto Counter |  |