| Param | Original file | Final file |
|---|---|---|
| Filename | modeM0/AS1C05_002T02_9000003432cztM0_level2_bc.evt | modeM0/AS1C05_002T02_9000003432cztM0_level2_quad_clean.evt |
| Size (bytes) | 225,414,720 | 58,129,920 |
| Size | 215.0 MB | 55.4 MB |
| Events in quadrant A | 946,576 | 373,933 |
| Events in quadrant B | 996,256 | 381,241 |
| Events in quadrant C | 1,721,272 | 354,025 |
| Events in quadrant D | 2,843,109 | 329,020 |
| Mode M9 | |||
|---|---|---|---|
| Quadrant | BADHDUFLAG | Total packets | Discarded packets |
| A | 0 | 9 | 0 |
| B | 0 | 9 | 0 |
| C | 0 | 9 | 0 |
| D | 0 | 9 | 0 |
| Mode SS | |||
|---|---|---|---|
| Quadrant | BADHDUFLAG | Total packets | Discarded packets |
| A | 0 | 100 | 0 |
| B | 0 | 98 | 0 |
| C | 0 | 98 | 0 |
| D | 0 | 100 | 0 |
| Mode M0 | |||
|---|---|---|---|
| Quadrant | BADHDUFLAG | Total packets | Discarded packets |
| A | 0 | 9607 | 0 |
| B | 0 | 9798 | 0 |
| C | 0 | 12571 | 0 |
| D | 0 | 16118 | 0 |
| Quadrant | Total seconds | Saturated seconds | Saturation percentage |
|---|---|---|---|
| A | 4589 | 33 | 0.719111% |
| B | 4594 | 75 | 1.632564% |
| C | 4538 | 307 | 6.765095% |
| D | 4532 | 747 | 16.482789% |
Noise dominated data is calculated using 1-second bins in cleaned event files. If a bin has >2000 counts, and if more than 50% of those come from <1% of pixels, then it is considered to be noise-dominated and hence unusable.
| Quadrant | # 1 sec bins | Bins with >0 counts | Bins with >2000 counts | High rate bins dominated by noise | Noise dominated (total time) | Noise dominated (detector-on time) | Marked lightcurve |
|---|---|---|---|---|---|---|---|
| A | 10848 | 4675 | 0 | 0 | 0.00% | 0.00% |  |
| B | 10848 | 4673 | 1 | 1 | 0.01% | 0.02% |  |
| C | 10848 | 4621 | 10 | 10 | 0.09% | 0.22% |  |
| D | 10847 | 4605 | 274 | 274 | 2.53% | 5.95% |  |
Top three noisy pixels from each quadrant. If the there are fewer than three noisy pixels in the level2.evt file, extra rows are filled as -1
| Pixel properties | Quadrant properties | ||||||
|---|---|---|---|---|---|---|---|
| Quadrant | DetID | PixID | Counts | Sigma | Mean | Median | Sigma |
| A | 13 | 254 | 6482 | 113.46 | 244 | 239 | 55.0 |
| A | 0 | 226 | 1585 | 24.46 | 244 | 239 | 55.0 |
| A | 12 | 194 | 1468 | 22.34 | 244 | 239 | 55.0 |
| B | 10 | 247 | 13757 | 268.64 | 248 | 241 | 50.3 |
| B | 3 | 64 | 13518 | 263.89 | 248 | 241 | 50.3 |
| B | 0 | 190 | 13448 | 262.5 | 248 | 241 | 50.3 |
| C | 2 | 16 | 699600 | 12543.89 | 228 | 226 | 55.8 |
| C | 0 | 10 | 131976 | 2363.05 | 228 | 226 | 55.8 |
| C | 7 | 247 | 8324 | 145.24 | 228 | 226 | 55.8 |
| D | 1 | 52 | 1087347 | 20077.2 | 222 | 212 | 54.1 |
| D | 2 | 82 | 354994 | 6552.11 | 222 | 212 | 54.1 |
| D | 7 | 238 | 241388 | 4454.04 | 222 | 212 | 54.1 |
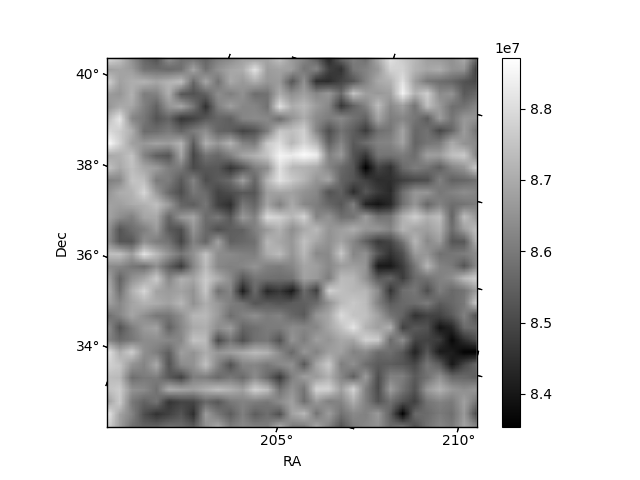
Histogram calculated using DETX and DETY for each event in the final _common_clean file
| Quadrant A |  |
 |
Quadrant B |
|---|---|---|---|
| Quadrant D |  |
 |
Quadrant C |
| Plot type | Count rate plots | Images |
|---|---|---|
| Comparison with Poisson distribution Blue bars denote a histogram of data divided into 1 sec bins. Red curve is a Poisson curve with rate = median count rate of data. |
 |
 |
| Quadrant-wise count rates Data is divided into 100 sec bins |
 |
|
| Module-wise count rates for Quadrant A Data is divided into 100 sec bins |
 |
 |
| Module-wise count rates for Quadrant B Data is divided into 100 sec bins |
 |
 |
| Module-wise count rates for Quadrant C Data is divided into 100 sec bins |
 |
 |
| Module-wise count rates for Quadrant D Data is divided into 100 sec bins |
 |
 |
| Parameter | Plot |
|---|---|
| CZT HV Monitor |  |
| D_VDD |  |
| Temperature 1 |  |
| Veto HV Monitor | 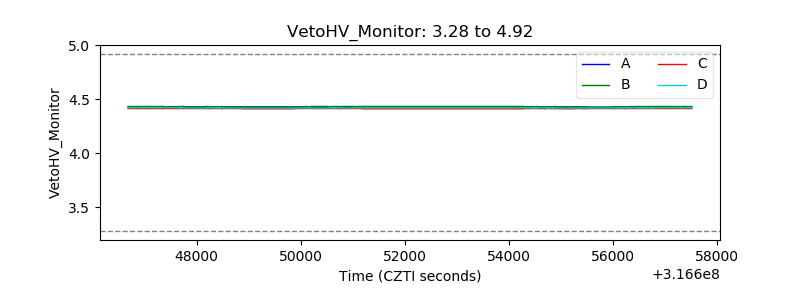 |
| Veto LLD |  |
| Alpha Counter |  |
| _CPM_Rate |  |
| CZT Counter |  |
| +2.5 Volts monitor | 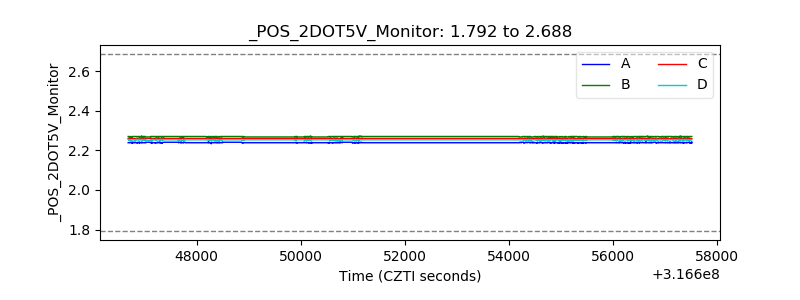 |
| +5 Volts monitor |  |
| _ROLL_ROT |  |
| _Roll_DEC |  |
| _Roll_RA |  |
| Veto Counter |  |