| Param | Original file | Final file |
|---|---|---|
| Filename | modeM0/AS1A08_003T05_9000003426cztM0_level2_bc.evt | modeM0/AS1A08_003T05_9000003426cztM0_level2_quad_clean.evt |
| Size (bytes) | 2,154,821,760 | 510,569,280 |
| Size | 2.0 GB | 486.9 MB |
| Events in quadrant A | 16,876,689 | 3,089,630 |
| Events in quadrant B | 9,549,724 | 3,246,226 |
| Events in quadrant C | 11,045,901 | 3,113,429 |
| Events in quadrant D | 24,758,293 | 2,962,147 |
| Mode M9 | |||
|---|---|---|---|
| Quadrant | BADHDUFLAG | Total packets | Discarded packets |
| A | 0 | 53 | 0 |
| B | 0 | 53 | 0 |
| C | 0 | 53 | 0 |
| D | 0 | 53 | 0 |
| Mode M0 | |||
|---|---|---|---|
| Quadrant | BADHDUFLAG | Total packets | Discarded packets |
| A | 0 | 115647 | 0 |
| B | 0 | 93747 | 0 |
| C | 0 | 99669 | 0 |
| D | 0 | 150784 | 0 |
| Mode SS | |||
|---|---|---|---|
| Quadrant | BADHDUFLAG | Total packets | Discarded packets |
| A | 0 | 908 | 0 |
| B | 0 | 908 | 0 |
| C | 0 | 908 | 0 |
| D | 0 | 908 | 0 |
| Quadrant | Total seconds | Saturated seconds | Saturation percentage |
|---|---|---|---|
| A | 44449 | 3325 | 7.480483% |
| B | 44449 | 672 | 1.511845% |
| C | 44449 | 1234 | 2.776215% |
| D | 44449 | 5408 | 12.166753% |
Noise dominated data is calculated using 1-second bins in cleaned event files. If a bin has >2000 counts, and if more than 50% of those come from <1% of pixels, then it is considered to be noise-dominated and hence unusable.
| Quadrant | # 1 sec bins | Bins with >0 counts | Bins with >2000 counts | High rate bins dominated by noise | Noise dominated (total time) | Noise dominated (detector-on time) | Marked lightcurve |
|---|---|---|---|---|---|---|---|
| A | 49724 | 44447 | 1664 | 1664 | 3.35% | 3.74% |  |
| B | 49724 | 44449 | 7 | 7 | 0.01% | 0.02% |  |
| C | 49724 | 44448 | 34 | 34 | 0.07% | 0.08% |  |
| D | 49724 | 44445 | 900 | 900 | 1.81% | 2.02% |  |
Top three noisy pixels from each quadrant. If the there are fewer than three noisy pixels in the level2.evt file, extra rows are filled as -1
| Pixel properties | Quadrant properties | ||||||
|---|---|---|---|---|---|---|---|
| Quadrant | DetID | PixID | Counts | Sigma | Mean | Median | Sigma |
| A | 6 | 16 | 8048054 | 16137.46 | 2285 | 2240 | 498.6 |
| A | 13 | 254 | 59232 | 114.31 | 2285 | 2240 | 498.6 |
| A | 0 | 226 | 14534 | 24.66 | 2285 | 2240 | 498.6 |
| B | 0 | 190 | 174136 | 384.95 | 2363 | 2299 | 446.4 |
| B | 0 | 245 | 114967 | 252.4 | 2363 | 2299 | 446.4 |
| B | 0 | 229 | 66652 | 144.16 | 2363 | 2299 | 446.4 |
| C | 0 | 10 | 1357783 | 2555.39 | 2260 | 2246 | 530.5 |
| C | 7 | 247 | 363023 | 680.12 | 2260 | 2246 | 530.5 |
| C | 10 | 9 | 324333 | 607.18 | 2260 | 2246 | 530.5 |
| D | 7 | 238 | 6766410 | 12945.04 | 2218 | 2132 | 522.5 |
| D | 1 | 52 | 5443353 | 10413.06 | 2218 | 2132 | 522.5 |
| D | 12 | 233 | 2488391 | 4758.04 | 2218 | 2132 | 522.5 |
Histogram calculated using DETX and DETY for each event in the final _common_clean file
| Quadrant A |  |
 |
Quadrant B |
|---|---|---|---|
| Quadrant D |  |
 |
Quadrant C |
| Plot type | Count rate plots | Images |
|---|---|---|
| Comparison with Poisson distribution Blue bars denote a histogram of data divided into 1 sec bins. Red curve is a Poisson curve with rate = median count rate of data. |
 |
 |
| Quadrant-wise count rates Data is divided into 100 sec bins |
 |
|
| Module-wise count rates for Quadrant A Data is divided into 100 sec bins |
 |
 |
| Module-wise count rates for Quadrant B Data is divided into 100 sec bins |
 |
 |
| Module-wise count rates for Quadrant C Data is divided into 100 sec bins |
 |
 |
| Module-wise count rates for Quadrant D Data is divided into 100 sec bins |
 |
 |
| Parameter | Plot |
|---|---|
| CZT HV Monitor |  |
| D_VDD |  |
| Temperature 1 |  |
| Veto HV Monitor |  |
| Veto LLD |  |
| Alpha Counter |  |
| _CPM_Rate |  |
| CZT Counter |  |
| +2.5 Volts monitor | 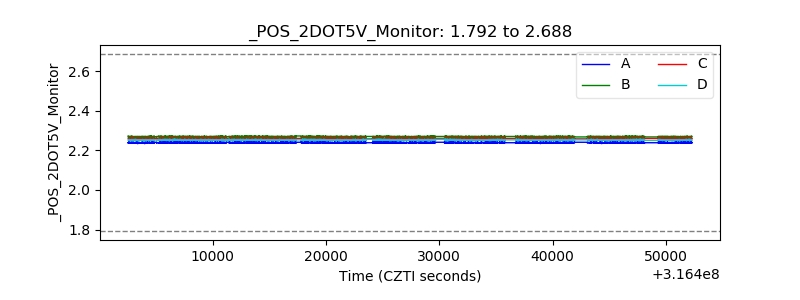 |
| +5 Volts monitor |  |
| _ROLL_ROT |  |
| _Roll_DEC |  |
| _Roll_RA |  |
| Veto Counter |  |