| Param | Original file | Final file |
|---|---|---|
| Filename | modeM0/AS1A07_148T05_9000003424cztM0_level2_bc.evt | modeM0/AS1A07_148T05_9000003424cztM0_level2_quad_clean.evt |
| Size (bytes) | 2,268,161,280 | 731,721,600 |
| Size | 2.1 GB | 697.8 MB |
| Events in quadrant A | 16,732,786 | 4,636,387 |
| Events in quadrant B | 12,820,088 | 4,817,107 |
| Events in quadrant C | 14,665,019 | 4,634,620 |
| Events in quadrant D | 20,899,277 | 4,474,430 |
| Mode SS | |||
|---|---|---|---|
| Quadrant | BADHDUFLAG | Total packets | Discarded packets |
| A | 0 | 1066 | 0 |
| B | 0 | 1066 | 0 |
| C | 0 | 1066 | 0 |
| D | 0 | 1066 | 0 |
| Mode M0 | |||
|---|---|---|---|
| Quadrant | BADHDUFLAG | Total packets | Discarded packets |
| A | 0 | 126984 | 0 |
| B | 0 | 116580 | 0 |
| C | 0 | 122752 | 0 |
| D | 0 | 140033 | 0 |
| Mode M9 | |||
|---|---|---|---|
| Quadrant | BADHDUFLAG | Total packets | Discarded packets |
| A | 0 | 108 | 0 |
| B | 0 | 108 | 0 |
| C | 0 | 108 | 0 |
| D | 0 | 108 | 0 |
| Quadrant | Total seconds | Saturated seconds | Saturation percentage |
|---|---|---|---|
| A | 52486 | 1941 | 3.698129% |
| B | 52486 | 1301 | 2.478756% |
| C | 52486 | 1661 | 3.164653% |
| D | 52485 | 2617 | 4.986187% |
Noise dominated data is calculated using 1-second bins in cleaned event files. If a bin has >2000 counts, and if more than 50% of those come from <1% of pixels, then it is considered to be noise-dominated and hence unusable.
| Quadrant | # 1 sec bins | Bins with >0 counts | Bins with >2000 counts | High rate bins dominated by noise | Noise dominated (total time) | Noise dominated (detector-on time) | Marked lightcurve |
|---|---|---|---|---|---|---|---|
| A | 66437 | 52486 | 869 | 869 | 1.31% | 1.66% | 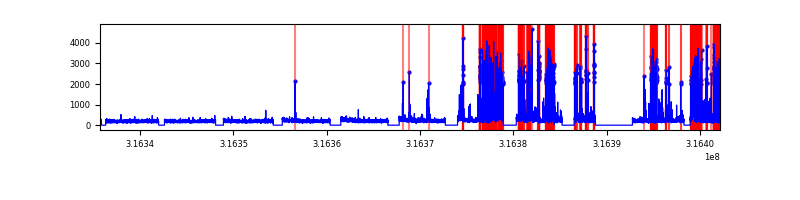 |
| B | 66437 | 52482 | 174 | 174 | 0.26% | 0.33% |  |
| C | 66437 | 52484 | 26 | 26 | 0.04% | 0.05% |  |
| D | 66437 | 52484 | 1196 | 1196 | 1.80% | 2.28% |  |
Top three noisy pixels from each quadrant. If the there are fewer than three noisy pixels in the level2.evt file, extra rows are filled as -1
| Pixel properties | Quadrant properties | ||||||
|---|---|---|---|---|---|---|---|
| Quadrant | DetID | PixID | Counts | Sigma | Mean | Median | Sigma |
| A | 6 | 16 | 5659883 | 9173.08 | 2868 | 2811 | 616.7 |
| A | 13 | 254 | 74076 | 115.56 | 2868 | 2811 | 616.7 |
| A | 0 | 226 | 18461 | 25.38 | 2868 | 2811 | 616.7 |
| B | 0 | 245 | 1188143 | 2188.44 | 2928 | 2865 | 541.6 |
| B | 0 | 190 | 239525 | 436.96 | 2928 | 2865 | 541.6 |
| B | 4 | 216 | 40737 | 69.92 | 2928 | 2865 | 541.6 |
| C | 0 | 10 | 1948193 | 2972.28 | 2817 | 2812 | 654.5 |
| C | 8 | 208 | 1494348 | 2278.87 | 2817 | 2812 | 654.5 |
| C | 2 | 16 | 260974 | 394.44 | 2817 | 2812 | 654.5 |
| D | 7 | 238 | 7456848 | 11362.59 | 2847 | 2754 | 656.0 |
| D | 1 | 52 | 756262 | 1148.6 | 2847 | 2754 | 656.0 |
| D | 1 | 239 | 737213 | 1119.57 | 2847 | 2754 | 656.0 |
Histogram calculated using DETX and DETY for each event in the final _common_clean file
| Quadrant A |  |
 |
Quadrant B |
|---|---|---|---|
| Quadrant D |  |
 |
Quadrant C |
| Plot type | Count rate plots | Images |
|---|---|---|
| Comparison with Poisson distribution Blue bars denote a histogram of data divided into 1 sec bins. Red curve is a Poisson curve with rate = median count rate of data. |
 |
 |
| Quadrant-wise count rates Data is divided into 100 sec bins |
 |
|
| Module-wise count rates for Quadrant A Data is divided into 100 sec bins |
 |
 |
| Module-wise count rates for Quadrant B Data is divided into 100 sec bins |
 |
 |
| Module-wise count rates for Quadrant C Data is divided into 100 sec bins |
 |
 |
| Module-wise count rates for Quadrant D Data is divided into 100 sec bins |
 |
 |
| Parameter | Plot |
|---|---|
| CZT HV Monitor |  |
| D_VDD |  |
| Temperature 1 |  |
| Veto HV Monitor |  |
| Veto LLD | 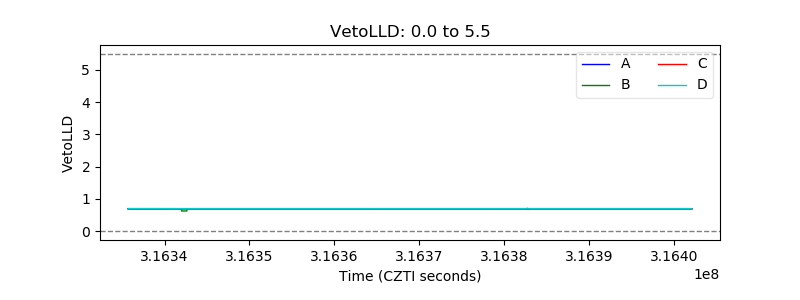 |
| Alpha Counter |  |
| _CPM_Rate |  |
| CZT Counter |  |
| +2.5 Volts monitor |  |
| +5 Volts monitor |  |
| _ROLL_ROT |  |
| _Roll_DEC |  |
| _Roll_RA |  |
| Veto Counter |  |