| Param | Original file | Final file |
|---|---|---|
| Filename | modeM0/AS1A08_009T01_9000003422cztM0_level2_bc.evt | modeM0/AS1A08_009T01_9000003422cztM0_level2_quad_clean.evt |
| Size (bytes) | 3,475,684,800 | 1,402,012,800 |
| Size | 3.2 GB | 1.3 GB |
| Events in quadrant A | 19,887,825 | 9,077,955 |
| Events in quadrant B | 20,457,006 | 9,293,662 |
| Events in quadrant C | 22,712,854 | 8,973,040 |
| Events in quadrant D | 35,672,019 | 8,552,023 |
| Mode M0 | |||
|---|---|---|---|
| Quadrant | BADHDUFLAG | Total packets | Discarded packets |
| A | 0 | 198695 | 0 |
| B | 0 | 200647 | 0 |
| C | 0 | 208367 | 0 |
| D | 0 | 255016 | 0 |
| Mode SS | |||
|---|---|---|---|
| Quadrant | BADHDUFLAG | Total packets | Discarded packets |
| A | 0 | 1946 | 0 |
| B | 0 | 1948 | 0 |
| C | 0 | 1946 | 0 |
| D | 0 | 1946 | 0 |
| Mode M9 | |||
|---|---|---|---|
| Quadrant | BADHDUFLAG | Total packets | Discarded packets |
| A | 0 | 133 | 0 |
| B | 0 | 133 | 0 |
| C | 0 | 133 | 0 |
| D | 0 | 133 | 0 |
| Quadrant | Total seconds | Saturated seconds | Saturation percentage |
|---|---|---|---|
| A | 95880 | 896 | 0.934501% |
| B | 95888 | 1089 | 1.135700% |
| C | 95881 | 2044 | 2.131809% |
| D | 95886 | 5650 | 5.892414% |
Noise dominated data is calculated using 1-second bins in cleaned event files. If a bin has >2000 counts, and if more than 50% of those come from <1% of pixels, then it is considered to be noise-dominated and hence unusable.
| Quadrant | # 1 sec bins | Bins with >0 counts | Bins with >2000 counts | High rate bins dominated by noise | Noise dominated (total time) | Noise dominated (detector-on time) | Marked lightcurve |
|---|---|---|---|---|---|---|---|
| A | 108997 | 95891 | 10 | 10 | 0.01% | 0.01% | 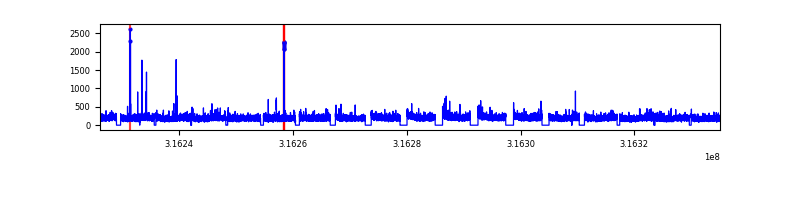 |
| B | 108997 | 95897 | 17 | 17 | 0.02% | 0.02% |  |
| C | 108997 | 95888 | 44 | 44 | 0.04% | 0.05% |  |
| D | 108997 | 95897 | 1714 | 1714 | 1.57% | 1.79% |  |
Top three noisy pixels from each quadrant. If the there are fewer than three noisy pixels in the level2.evt file, extra rows are filled as -1
| Pixel properties | Quadrant properties | ||||||
|---|---|---|---|---|---|---|---|
| Quadrant | DetID | PixID | Counts | Sigma | Mean | Median | Sigma |
| A | 6 | 16 | 228713 | 204.4 | 5060 | 4971 | 1094.6 |
| A | 13 | 254 | 127494 | 111.93 | 5060 | 4971 | 1094.6 |
| A | 15 | 174 | 94012 | 81.34 | 5060 | 4971 | 1094.6 |
| B | 0 | 190 | 267531 | 272.22 | 5141 | 5018 | 964.3 |
| B | 10 | 247 | 119766 | 118.99 | 5141 | 5018 | 964.3 |
| B | 0 | 189 | 79505 | 77.24 | 5141 | 5018 | 964.3 |
| C | 0 | 10 | 1711485 | 1467.08 | 4931 | 4907 | 1163.2 |
| C | 8 | 208 | 857149 | 732.64 | 4931 | 4907 | 1163.2 |
| C | 3 | 233 | 504058 | 429.1 | 4931 | 4907 | 1163.2 |
| D | 1 | 52 | 11294816 | 9831.71 | 4911 | 4740 | 1148.3 |
| D | 1 | 239 | 2368367 | 2058.31 | 4911 | 4740 | 1148.3 |
| D | 7 | 238 | 1058486 | 917.63 | 4911 | 4740 | 1148.3 |
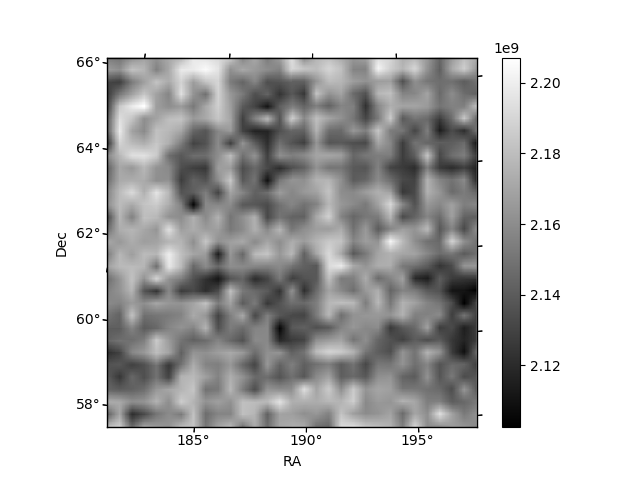
Histogram calculated using DETX and DETY for each event in the final _common_clean file
| Quadrant A | 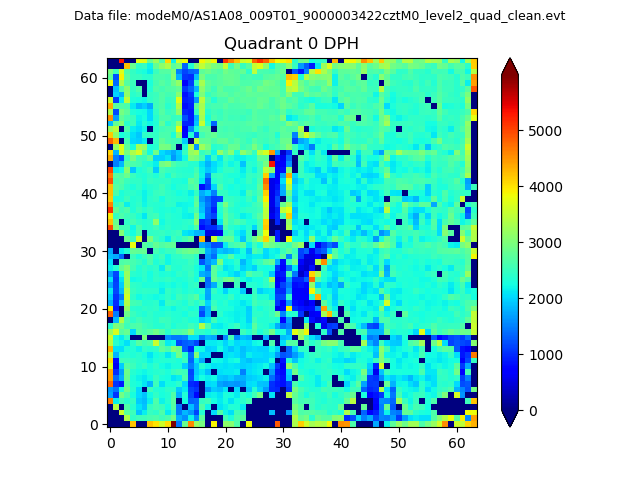 |
 |
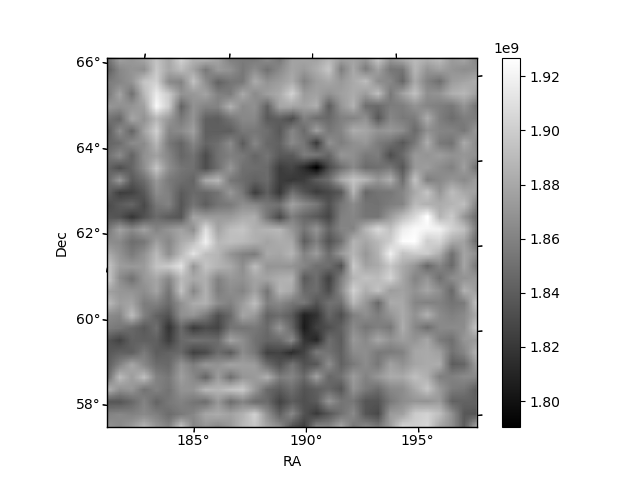
Quadrant B |
|---|---|---|---|
| Quadrant D | 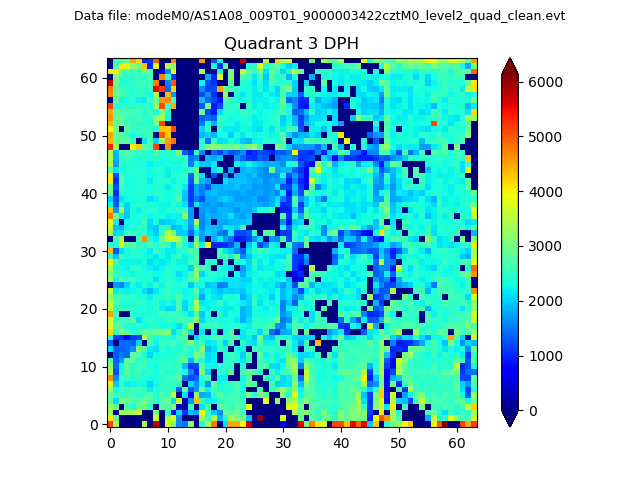 |
 |
Quadrant C |
| Plot type | Count rate plots | Images |
|---|---|---|
| Comparison with Poisson distribution Blue bars denote a histogram of data divided into 1 sec bins. Red curve is a Poisson curve with rate = median count rate of data. |
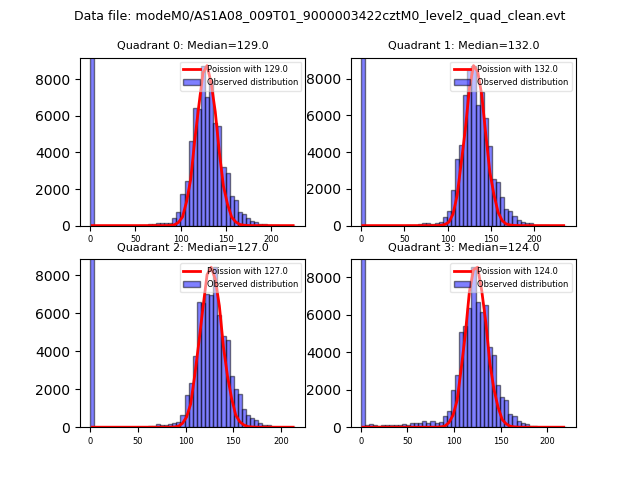 |
 |
| Quadrant-wise count rates Data is divided into 100 sec bins |
 |
|
| Module-wise count rates for Quadrant A Data is divided into 100 sec bins |
 |
 |
| Module-wise count rates for Quadrant B Data is divided into 100 sec bins |
 |
 |
| Module-wise count rates for Quadrant C Data is divided into 100 sec bins |
 |
 |
| Module-wise count rates for Quadrant D Data is divided into 100 sec bins |
 |
 |
| Parameter | Plot |
|---|---|
| CZT HV Monitor |  |
| D_VDD |  |
| Temperature 1 |  |
| Veto HV Monitor |  |
| Veto LLD | 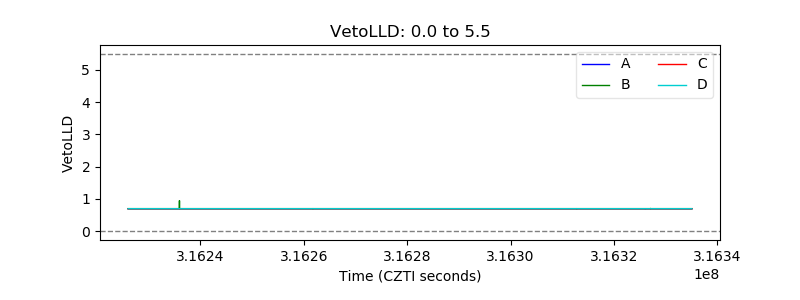 |
| Alpha Counter |  |
| _CPM_Rate | 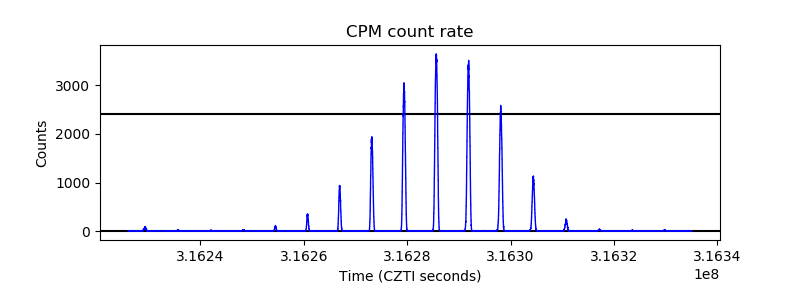 |
| CZT Counter |  |
| +2.5 Volts monitor |  |
| +5 Volts monitor |  |
| _ROLL_ROT |  |
| _Roll_DEC |  |
| _Roll_RA |  |
| Veto Counter |  |