| Param | Original file | Final file |
|---|---|---|
| Filename | modeM0/AS1T03_175T01_9000003420cztM0_level2_bc.evt | modeM0/AS1T03_175T01_9000003420cztM0_level2_quad_clean.evt |
| Size (bytes) | 91,180,800 | 37,261,440 |
| Size | 87.0 MB | 35.5 MB |
| Events in quadrant A | 538,473 | 235,871 |
| Events in quadrant B | 580,799 | 243,010 |
| Events in quadrant C | 615,899 | 236,408 |
| Events in quadrant D | 843,299 | 228,873 |
| Mode M9 | |||
|---|---|---|---|
| Quadrant | BADHDUFLAG | Total packets | Discarded packets |
| A | 0 | 11 | 0 |
| B | 0 | 11 | 0 |
| C | 0 | 11 | 0 |
| D | 0 | 11 | 0 |
| Mode M0 | |||
|---|---|---|---|
| Quadrant | BADHDUFLAG | Total packets | Discarded packets |
| A | 0 | 5515 | 0 |
| B | 0 | 5686 | 0 |
| C | 0 | 5960 | 0 |
| D | 0 | 6433 | 0 |
| Mode SS | |||
|---|---|---|---|
| Quadrant | BADHDUFLAG | Total packets | Discarded packets |
| A | 0 | 54 | 0 |
| B | 0 | 54 | 0 |
| C | 0 | 54 | 0 |
| D | 0 | 54 | 0 |
| Quadrant | Total seconds | Saturated seconds | Saturation percentage |
|---|---|---|---|
| A | 2561 | 41 | 1.600937% |
| B | 2561 | 70 | 2.733307% |
| C | 2561 | 130 | 5.076142% |
| D | 2561 | 81 | 3.162827% |
Noise dominated data is calculated using 1-second bins in cleaned event files. If a bin has >2000 counts, and if more than 50% of those come from <1% of pixels, then it is considered to be noise-dominated and hence unusable.
| Quadrant | # 1 sec bins | Bins with >0 counts | Bins with >2000 counts | High rate bins dominated by noise | Noise dominated (total time) | Noise dominated (detector-on time) | Marked lightcurve |
|---|---|---|---|---|---|---|---|
| A | 3656 | 2560 | 0 | 0 | 0.00% | 0.00% |  |
| B | 3656 | 2560 | 3 | 3 | 0.08% | 0.12% |  |
| C | 3656 | 2561 | 0 | 0 | 0.00% | 0.00% |  |
| D | 3656 | 2561 | 7 | 7 | 0.19% | 0.27% |  |
Top three noisy pixels from each quadrant. If the there are fewer than three noisy pixels in the level2.evt file, extra rows are filled as -1
| Pixel properties | Quadrant properties | ||||||
|---|---|---|---|---|---|---|---|
| Quadrant | DetID | PixID | Counts | Sigma | Mean | Median | Sigma |
| A | 13 | 254 | 3534 | 105.73 | 138 | 134 | 32.2 |
| A | 6 | 16 | 3187 | 94.94 | 138 | 134 | 32.2 |
| A | 0 | 226 | 908 | 24.07 | 138 | 134 | 32.2 |
| B | 10 | 247 | 26426 | 906.05 | 141 | 137 | 29.0 |
| B | 0 | 190 | 6555 | 221.18 | 141 | 137 | 29.0 |
| B | 3 | 209 | 2935 | 96.42 | 141 | 137 | 29.0 |
| C | 0 | 10 | 86439 | 2603.41 | 133 | 132 | 33.2 |
| C | 7 | 247 | 9273 | 275.73 | 133 | 132 | 33.2 |
| C | 8 | 208 | 4513 | 132.15 | 133 | 132 | 33.2 |
| D | 1 | 52 | 169907 | 4990.2 | 137 | 132 | 34.0 |
| D | 6 | 112 | 39127 | 1146.18 | 137 | 132 | 34.0 |
| D | 7 | 238 | 34616 | 1013.59 | 137 | 132 | 34.0 |
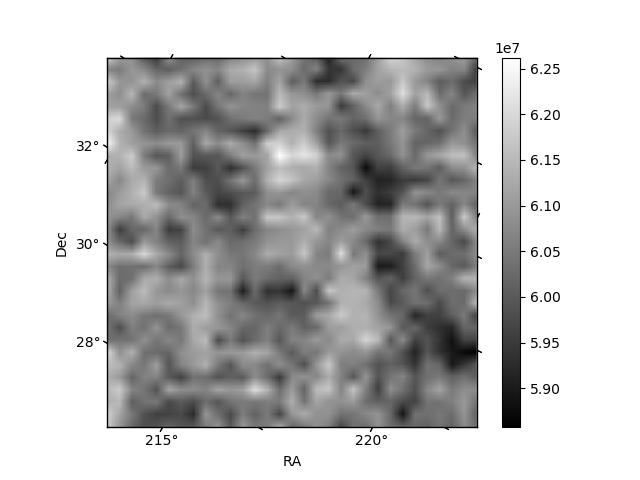
Histogram calculated using DETX and DETY for each event in the final _common_clean file
| Quadrant A |  |
 |
Quadrant B |
|---|---|---|---|
| Quadrant D |  |
 |
Quadrant C |
| Plot type | Count rate plots | Images |
|---|---|---|
| Comparison with Poisson distribution Blue bars denote a histogram of data divided into 1 sec bins. Red curve is a Poisson curve with rate = median count rate of data. |
 |
 |
| Quadrant-wise count rates Data is divided into 100 sec bins |
 |
|
| Module-wise count rates for Quadrant A Data is divided into 100 sec bins |
 |
 |
| Module-wise count rates for Quadrant B Data is divided into 100 sec bins |
 |
 |
| Module-wise count rates for Quadrant C Data is divided into 100 sec bins |
 |
 |
| Module-wise count rates for Quadrant D Data is divided into 100 sec bins |
 |
 |
| Parameter | Plot |
|---|---|
| CZT HV Monitor | 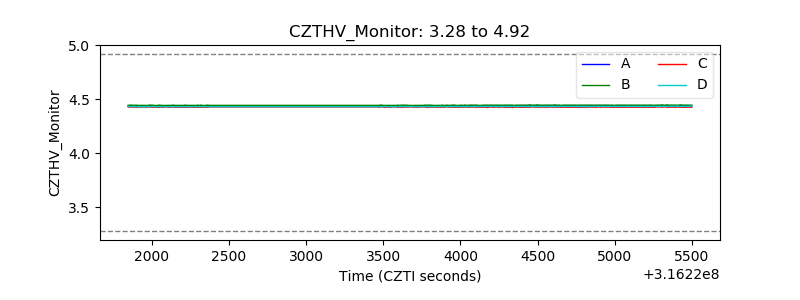 |
| D_VDD | 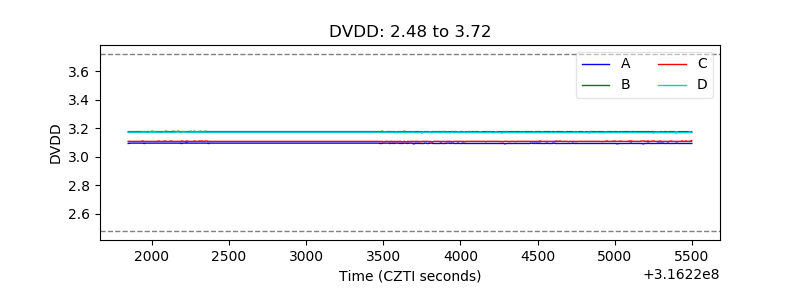 |
| Temperature 1 |  |
| Veto HV Monitor |  |
| Veto LLD | 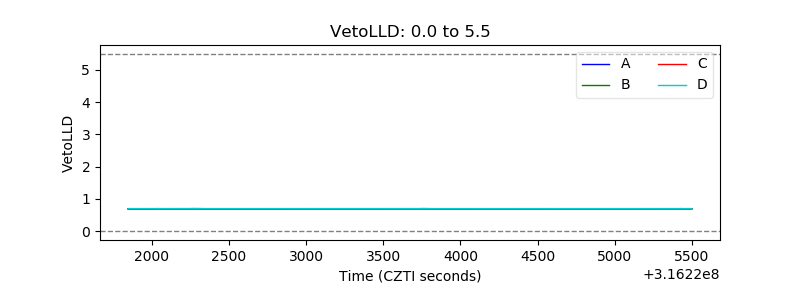 |
| Alpha Counter |  |
| _CPM_Rate |  |
| CZT Counter |  |
| +2.5 Volts monitor |  |
| +5 Volts monitor |  |
| _ROLL_ROT | 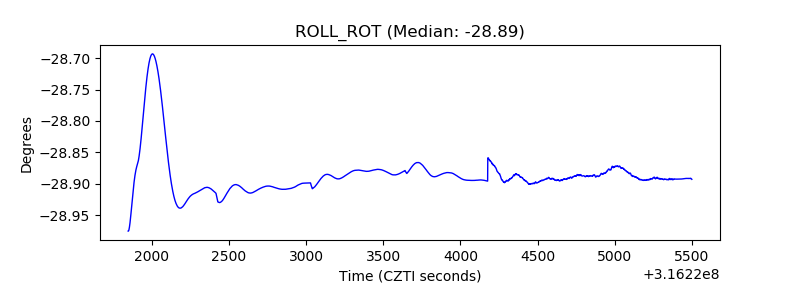 |
| _Roll_DEC |  |
| _Roll_RA |  |
| Veto Counter |  |