| Param | Original file | Final file |
|---|---|---|
| Filename | modeM0/AS1C05_002T03_9000003418cztM0_level2_bc.evt | modeM0/AS1C05_002T03_9000003418cztM0_level2_quad_clean.evt |
| Size (bytes) | 282,309,120 | 145,730,880 |
| Size | 269.2 MB | 139.0 MB |
| Events in quadrant A | 1,707,813 | 964,925 |
| Events in quadrant B | 1,778,082 | 1,000,478 |
| Events in quadrant C | 1,849,422 | 969,545 |
| Events in quadrant D | 2,663,224 | 924,814 |
| Mode M9 | |||
|---|---|---|---|
| Quadrant | BADHDUFLAG | Total packets | Discarded packets |
| A | 0 | 14 | 0 |
| B | 0 | 14 | 0 |
| C | 0 | 14 | 0 |
| D | 0 | 14 | 0 |
| Mode SS | |||
|---|---|---|---|
| Quadrant | BADHDUFLAG | Total packets | Discarded packets |
| A | 0 | 162 | 0 |
| B | 0 | 162 | 0 |
| C | 0 | 162 | 0 |
| D | 0 | 162 | 0 |
| Mode M0 | |||
|---|---|---|---|
| Quadrant | BADHDUFLAG | Total packets | Discarded packets |
| A | 0 | 16392 | 0 |
| B | 0 | 16600 | 0 |
| C | 0 | 17051 | 0 |
| D | 0 | 19986 | 0 |
| Quadrant | Total seconds | Saturated seconds | Saturation percentage |
|---|---|---|---|
| A | 7975 | 33 | 0.413793% |
| B | 7975 | 48 | 0.601881% |
| C | 7975 | 142 | 1.780564% |
| D | 7975 | 314 | 3.937304% |
Noise dominated data is calculated using 1-second bins in cleaned event files. If a bin has >2000 counts, and if more than 50% of those come from <1% of pixels, then it is considered to be noise-dominated and hence unusable.
| Quadrant | # 1 sec bins | Bins with >0 counts | Bins with >2000 counts | High rate bins dominated by noise | Noise dominated (total time) | Noise dominated (detector-on time) | Marked lightcurve |
|---|---|---|---|---|---|---|---|
| A | 9360 | 7975 | 0 | 0 | 0.00% | 0.00% |  |
| B | 9360 | 7975 | 2 | 2 | 0.02% | 0.03% |  |
| C | 9360 | 7975 | 0 | 0 | 0.00% | 0.00% |  |
| D | 9360 | 7975 | 75 | 75 | 0.80% | 0.94% |  |
Top three noisy pixels from each quadrant. If the there are fewer than three noisy pixels in the level2.evt file, extra rows are filled as -1
| Pixel properties | Quadrant properties | ||||||
|---|---|---|---|---|---|---|---|
| Quadrant | DetID | PixID | Counts | Sigma | Mean | Median | Sigma |
| A | 6 | 16 | 16229 | 163.75 | 438 | 430 | 96.5 |
| A | 13 | 254 | 10854 | 108.04 | 438 | 430 | 96.5 |
| A | 0 | 226 | 2806 | 24.63 | 438 | 430 | 96.5 |
| B | 14 | 207 | 23830 | 272.29 | 451 | 442 | 85.9 |
| B | 5 | 172 | 7933 | 87.21 | 451 | 442 | 85.9 |
| B | 4 | 216 | 5134 | 54.63 | 451 | 442 | 85.9 |
| C | 0 | 10 | 100152 | 955.16 | 434 | 433 | 104.4 |
| C | 7 | 247 | 37232 | 352.48 | 434 | 433 | 104.4 |
| C | 8 | 208 | 35649 | 337.32 | 434 | 433 | 104.4 |
| D | 1 | 52 | 521214 | 5073.69 | 433 | 419 | 102.6 |
| D | 2 | 136 | 317172 | 3085.87 | 433 | 419 | 102.6 |
| D | 7 | 238 | 63083 | 610.49 | 433 | 419 | 102.6 |
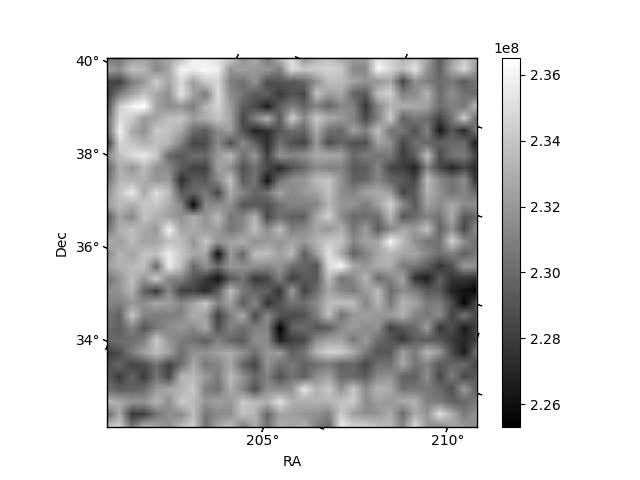
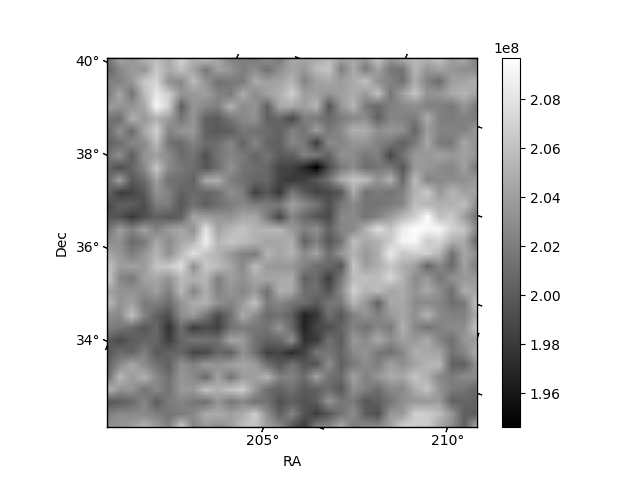
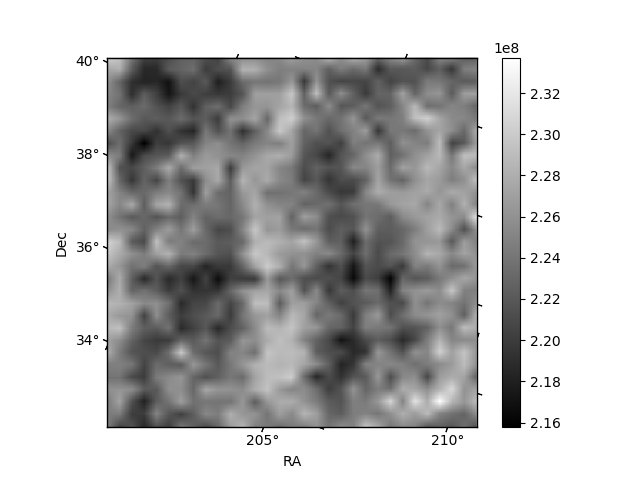
Histogram calculated using DETX and DETY for each event in the final _common_clean file
| Quadrant A |  |
 |
Quadrant B |
|---|---|---|---|
| Quadrant D |  |
 |
Quadrant C |
| Plot type | Count rate plots | Images |
|---|---|---|
| Comparison with Poisson distribution Blue bars denote a histogram of data divided into 1 sec bins. Red curve is a Poisson curve with rate = median count rate of data. |
 |
 |
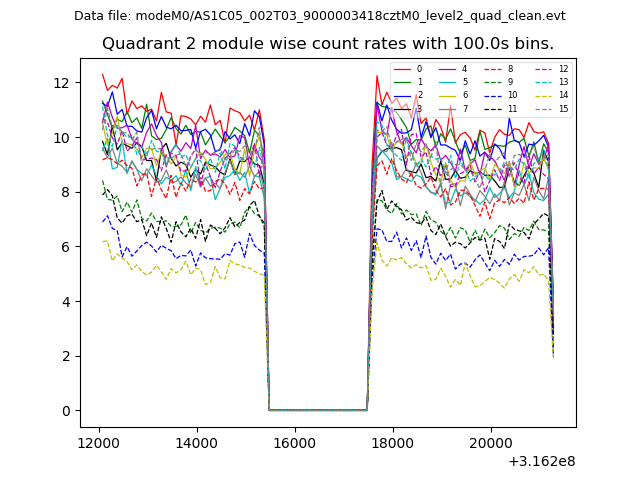
| Quadrant-wise count rates Data is divided into 100 sec bins |
 |
|
| Module-wise count rates for Quadrant A Data is divided into 100 sec bins |
 |
 |
| Module-wise count rates for Quadrant B Data is divided into 100 sec bins |
 |
 |
| Module-wise count rates for Quadrant C Data is divided into 100 sec bins |
 |
 |
| Module-wise count rates for Quadrant D Data is divided into 100 sec bins |
 |
 |
| Parameter | Plot |
|---|---|
| CZT HV Monitor |  |
| D_VDD |  |
| Temperature 1 |  |
| Veto HV Monitor |  |
| Veto LLD |  |
| Alpha Counter | 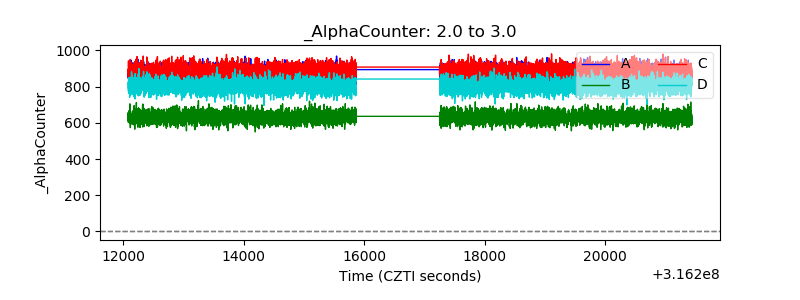 |
| _CPM_Rate | 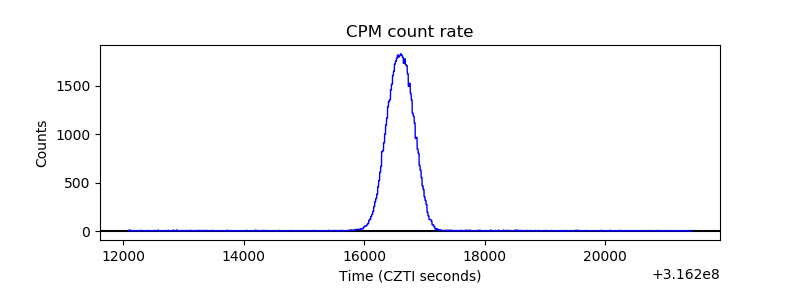 |
| CZT Counter |  |
| +2.5 Volts monitor |  |
| +5 Volts monitor |  |
| _ROLL_ROT |  |
| _Roll_DEC |  |
| _Roll_RA | 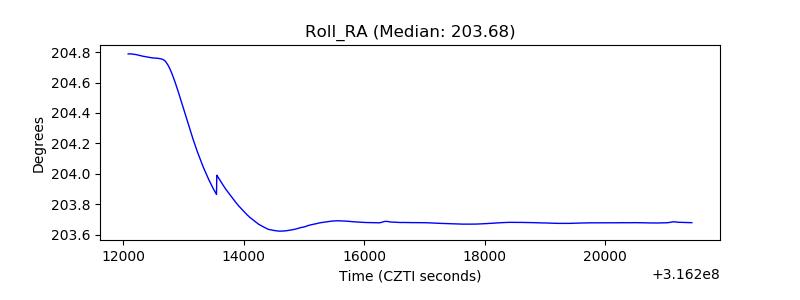 |
| Veto Counter |  |