| Param | Original file | Final file |
|---|---|---|
| Filename | modeM0/AS1A07_138T03_9000003412cztM0_level2_bc.evt | modeM0/AS1A07_138T03_9000003412cztM0_level2_quad_clean.evt |
| Size (bytes) | 621,411,840 | 179,640,000 |
| Size | 592.6 MB | 171.3 MB |
| Events in quadrant A | 7,279,375 | 1,076,733 |
| Events in quadrant B | 2,978,301 | 1,166,459 |
| Events in quadrant C | 2,836,250 | 1,118,721 |
| Events in quadrant D | 4,746,953 | 1,092,938 |
| Mode SS | |||
|---|---|---|---|
| Quadrant | BADHDUFLAG | Total packets | Discarded packets |
| A | 0 | 292 | 0 |
| B | 0 | 292 | 0 |
| C | 0 | 292 | 0 |
| D | 0 | 292 | 0 |
| Mode M9 | |||
|---|---|---|---|
| Quadrant | BADHDUFLAG | Total packets | Discarded packets |
| A | 0 | 18 | 0 |
| B | 0 | 18 | 0 |
| C | 0 | 18 | 0 |
| D | 0 | 18 | 0 |
| Mode M0 | |||
|---|---|---|---|
| Quadrant | BADHDUFLAG | Total packets | Discarded packets |
| A | 0 | 42108 | 0 |
| B | 0 | 29459 | 0 |
| C | 0 | 29280 | 0 |
| D | 0 | 35837 | 0 |
| Quadrant | Total seconds | Saturated seconds | Saturation percentage |
|---|---|---|---|
| A | 14269 | 1624 | 11.381316% |
| B | 14269 | 125 | 0.876025% |
| C | 14269 | 151 | 1.058238% |
| D | 14269 | 543 | 3.805452% |
Noise dominated data is calculated using 1-second bins in cleaned event files. If a bin has >2000 counts, and if more than 50% of those come from <1% of pixels, then it is considered to be noise-dominated and hence unusable.
| Quadrant | # 1 sec bins | Bins with >0 counts | Bins with >2000 counts | High rate bins dominated by noise | Noise dominated (total time) | Noise dominated (detector-on time) | Marked lightcurve |
|---|---|---|---|---|---|---|---|
| A | 15733 | 14268 | 1054 | 1054 | 6.70% | 7.39% |  |
| B | 15733 | 14267 | 4 | 4 | 0.03% | 0.03% |  |
| C | 15733 | 14268 | 1 | 1 | 0.01% | 0.01% |  |
| D | 15733 | 14267 | 70 | 70 | 0.44% | 0.49% | 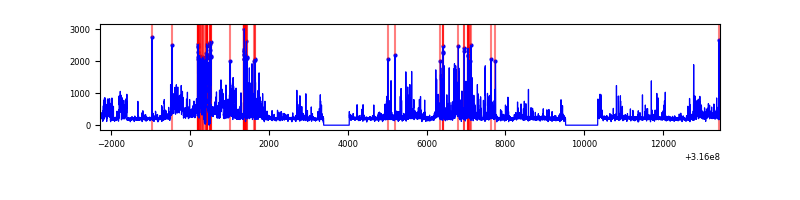 |
Top three noisy pixels from each quadrant. If the there are fewer than three noisy pixels in the level2.evt file, extra rows are filled as -1
| Pixel properties | Quadrant properties | ||||||
|---|---|---|---|---|---|---|---|
| Quadrant | DetID | PixID | Counts | Sigma | Mean | Median | Sigma |
| A | 6 | 16 | 4645094 | 30540.21 | 679 | 665 | 152.1 |
| A | 13 | 254 | 18382 | 116.5 | 679 | 665 | 152.1 |
| A | 10 | 253 | 8076 | 48.73 | 679 | 665 | 152.1 |
| B | 0 | 190 | 90489 | 641.03 | 721 | 703 | 140.1 |
| B | 4 | 216 | 34252 | 239.53 | 721 | 703 | 140.1 |
| B | 0 | 189 | 28291 | 196.97 | 721 | 703 | 140.1 |
| C | 2 | 16 | 73355 | 440.96 | 687 | 683 | 164.8 |
| C | 0 | 207 | 47869 | 286.32 | 687 | 683 | 164.8 |
| C | 0 | 10 | 22596 | 132.97 | 687 | 683 | 164.8 |
| D | 13 | 153 | 574458 | 3478.1 | 690 | 664 | 165.0 |
| D | 1 | 52 | 496616 | 3006.25 | 690 | 664 | 165.0 |
| D | 12 | 227 | 387931 | 2347.45 | 690 | 664 | 165.0 |
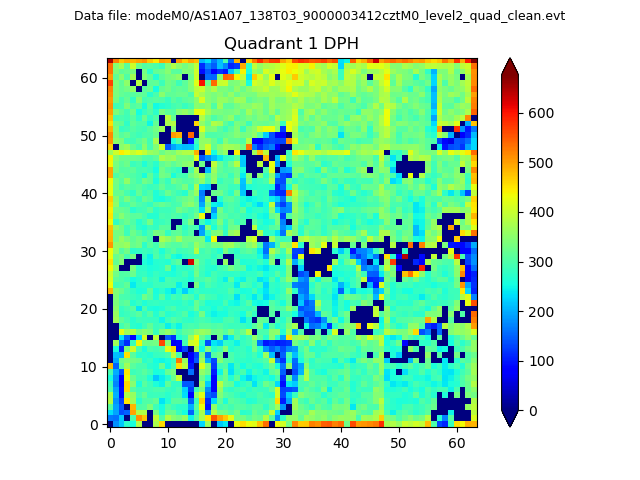
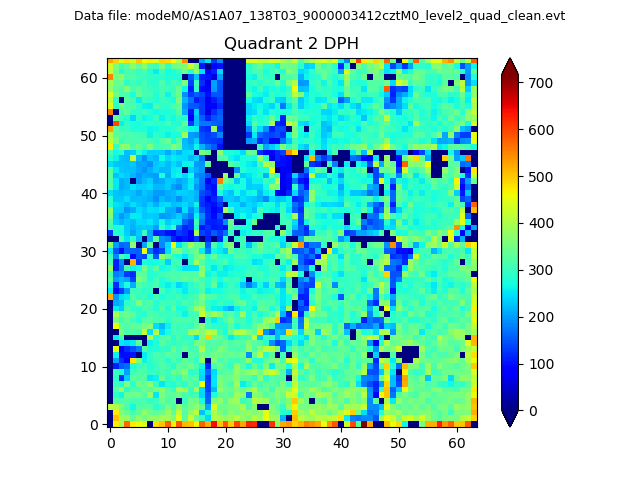
Histogram calculated using DETX and DETY for each event in the final _common_clean file
| Quadrant A |  |
 |
Quadrant B |
|---|---|---|---|
| Quadrant D |  |
 |
Quadrant C |
| Plot type | Count rate plots | Images |
|---|---|---|
| Comparison with Poisson distribution Blue bars denote a histogram of data divided into 1 sec bins. Red curve is a Poisson curve with rate = median count rate of data. |
 |
 |
| Quadrant-wise count rates Data is divided into 100 sec bins |
 |
|
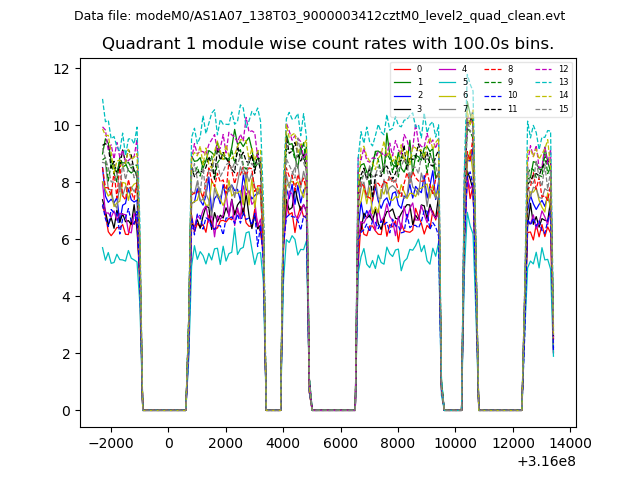
| Module-wise count rates for Quadrant A Data is divided into 100 sec bins |
 |
 |
| Module-wise count rates for Quadrant B Data is divided into 100 sec bins |
 |
 |
| Module-wise count rates for Quadrant C Data is divided into 100 sec bins |
 |
 |
| Module-wise count rates for Quadrant D Data is divided into 100 sec bins |
 |
 |
| Parameter | Plot |
|---|---|
| CZT HV Monitor |  |
| D_VDD |  |
| Temperature 1 |  |
| Veto HV Monitor |  |
| Veto LLD |  |
| Alpha Counter |  |
| _CPM_Rate |  |
| CZT Counter |  |
| +2.5 Volts monitor |  |
| +5 Volts monitor |  |
| _ROLL_ROT | 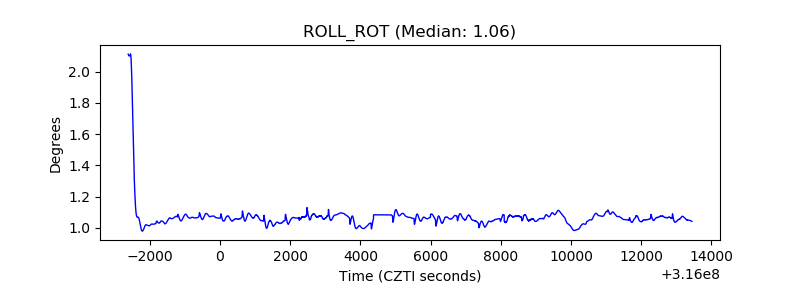 |
| _Roll_DEC |  |
| _Roll_RA |  |
| Veto Counter | 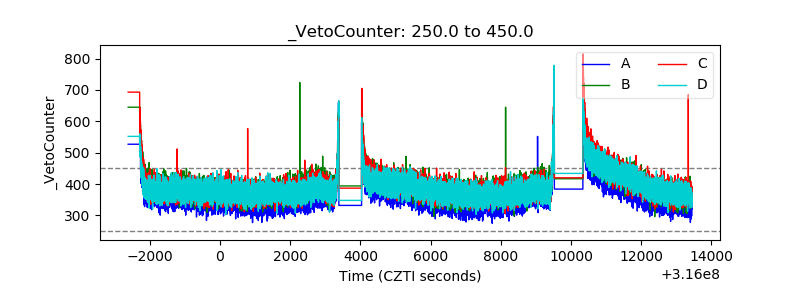 |