| Param | Original file | Final file |
|---|---|---|
| Filename | modeM0/AS1A07_138T05_9000003410cztM0_level2_bc.evt | modeM0/AS1A07_138T05_9000003410cztM0_level2_quad_clean.evt |
| Size (bytes) | 1,723,317,120 | 557,251,200 |
| Size | 1.6 GB | 531.4 MB |
| Events in quadrant A | 15,022,429 | 3,487,498 |
| Events in quadrant B | 9,404,682 | 3,641,799 |
| Events in quadrant C | 9,609,681 | 3,506,308 |
| Events in quadrant D | 15,327,944 | 3,396,803 |
| Mode SS | |||
|---|---|---|---|
| Quadrant | BADHDUFLAG | Total packets | Discarded packets |
| A | 0 | 842 | 0 |
| B | 0 | 842 | 0 |
| C | 0 | 842 | 0 |
| D | 0 | 842 | 0 |
| Mode M9 | |||
|---|---|---|---|
| Quadrant | BADHDUFLAG | Total packets | Discarded packets |
| A | 0 | 58 | 0 |
| B | 0 | 58 | 0 |
| C | 0 | 58 | 0 |
| D | 0 | 58 | 0 |
| Mode M0 | |||
|---|---|---|---|
| Quadrant | BADHDUFLAG | Total packets | Discarded packets |
| A | 0 | 105603 | 0 |
| B | 0 | 89401 | 0 |
| C | 0 | 91126 | 0 |
| D | 0 | 109116 | 0 |
| Quadrant | Total seconds | Saturated seconds | Saturation percentage |
|---|---|---|---|
| A | 41461 | 2029 | 4.893756% |
| B | 41461 | 657 | 1.584622% |
| C | 41461 | 915 | 2.206893% |
| D | 41461 | 1421 | 3.427317% |
Noise dominated data is calculated using 1-second bins in cleaned event files. If a bin has >2000 counts, and if more than 50% of those come from <1% of pixels, then it is considered to be noise-dominated and hence unusable.
| Quadrant | # 1 sec bins | Bins with >0 counts | Bins with >2000 counts | High rate bins dominated by noise | Noise dominated (total time) | Noise dominated (detector-on time) | Marked lightcurve |
|---|---|---|---|---|---|---|---|
| A | 47171 | 41461 | 1009 | 1009 | 2.14% | 2.43% |  |
| B | 47171 | 41461 | 33 | 33 | 0.07% | 0.08% |  |
| C | 47171 | 41460 | 53 | 53 | 0.11% | 0.13% |  |
| D | 47171 | 41460 | 142 | 142 | 0.30% | 0.34% |  |
Top three noisy pixels from each quadrant. If the there are fewer than three noisy pixels in the level2.evt file, extra rows are filled as -1
| Pixel properties | Quadrant properties | ||||||
|---|---|---|---|---|---|---|---|
| Quadrant | DetID | PixID | Counts | Sigma | Mean | Median | Sigma |
| A | 6 | 16 | 6588229 | 13947.38 | 2184 | 2142 | 472.2 |
| A | 13 | 254 | 57914 | 118.11 | 2184 | 2142 | 472.2 |
| A | 0 | 226 | 13953 | 25.01 | 2184 | 2142 | 472.2 |
| B | 0 | 190 | 213841 | 499.74 | 2255 | 2200 | 423.5 |
| B | 0 | 189 | 179397 | 418.41 | 2255 | 2200 | 423.5 |
| B | 4 | 216 | 96768 | 223.3 | 2255 | 2200 | 423.5 |
| C | 0 | 207 | 621641 | 1216.93 | 2166 | 2157 | 509.1 |
| C | 0 | 10 | 574316 | 1123.96 | 2166 | 2157 | 509.1 |
| C | 2 | 16 | 59432 | 112.51 | 2166 | 2157 | 509.1 |
| D | 7 | 238 | 2449597 | 4729.71 | 2187 | 2106 | 517.5 |
| D | 13 | 153 | 1881026 | 3630.96 | 2187 | 2106 | 517.5 |
| D | 1 | 52 | 989768 | 1908.63 | 2187 | 2106 | 517.5 |
Histogram calculated using DETX and DETY for each event in the final _common_clean file
| Quadrant A |  |
 |
Quadrant B |
|---|---|---|---|
| Quadrant D |  |
 |
Quadrant C |
| Plot type | Count rate plots | Images |
|---|---|---|
| Comparison with Poisson distribution Blue bars denote a histogram of data divided into 1 sec bins. Red curve is a Poisson curve with rate = median count rate of data. |
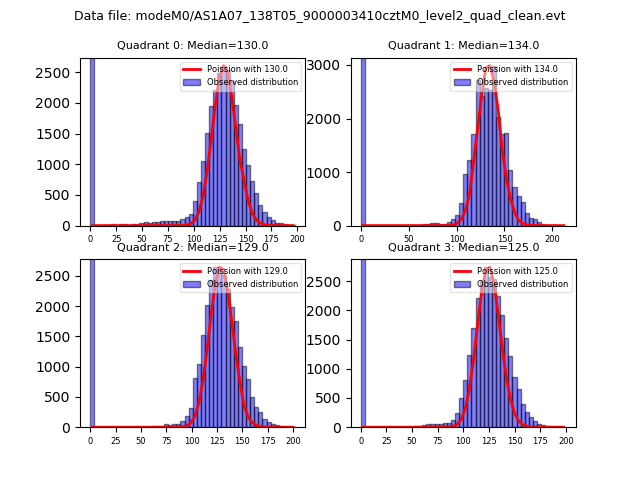 |
 |
| Quadrant-wise count rates Data is divided into 100 sec bins |
 |
|
| Module-wise count rates for Quadrant A Data is divided into 100 sec bins |
 |
 |
| Module-wise count rates for Quadrant B Data is divided into 100 sec bins |
 |
 |
| Module-wise count rates for Quadrant C Data is divided into 100 sec bins |
 |
 |
| Module-wise count rates for Quadrant D Data is divided into 100 sec bins |
 |
 |
| Parameter | Plot |
|---|---|
| CZT HV Monitor |  |
| D_VDD |  |
| Temperature 1 |  |
| Veto HV Monitor | 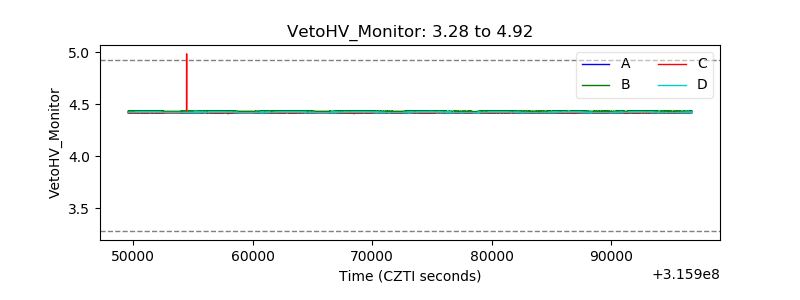 |
| Veto LLD |  |
| Alpha Counter |  |
| _CPM_Rate |  |
| CZT Counter |  |
| +2.5 Volts monitor |  |
| +5 Volts monitor |  |
| _ROLL_ROT |  |
| _Roll_DEC |  |
| _Roll_RA |  |
| Veto Counter |  |