| Param | Original file | Final file |
|---|---|---|
| Filename | modeM0/AS1A07_054T01_9000003406cztM0_level2_bc.evt | modeM0/AS1A07_054T01_9000003406cztM0_level2_quad_clean.evt |
| Size (bytes) | 2,649,971,520 | 1,164,870,720 |
| Size | 2.5 GB | 1.1 GB |
| Events in quadrant A | 14,669,483 | 7,779,342 |
| Events in quadrant B | 17,251,532 | 7,903,266 |
| Events in quadrant C | 15,637,149 | 7,555,908 |
| Events in quadrant D | 27,890,990 | 7,211,082 |
| Mode M0 | |||
|---|---|---|---|
| Quadrant | BADHDUFLAG | Total packets | Discarded packets |
| A | 0 | 145347 | 0 |
| B | 0 | 153519 | 0 |
| C | 0 | 150022 | 0 |
| D | 0 | 189684 | 0 |
| Mode SS | |||
|---|---|---|---|
| Quadrant | BADHDUFLAG | Total packets | Discarded packets |
| A | 0 | 1436 | 0 |
| B | 0 | 1436 | 0 |
| C | 0 | 1436 | 0 |
| D | 0 | 1436 | 0 |
| Mode M9 | |||
|---|---|---|---|
| Quadrant | BADHDUFLAG | Total packets | Discarded packets |
| A | 0 | 98 | 0 |
| B | 0 | 98 | 0 |
| C | 0 | 98 | 0 |
| D | 0 | 98 | 0 |
| Quadrant | Total seconds | Saturated seconds | Saturation percentage |
|---|---|---|---|
| A | 70510 | 751 | 1.065097% |
| B | 70510 | 1552 | 2.201106% |
| C | 70510 | 1467 | 2.080556% |
| D | 70510 | 3938 | 5.585023% |
Noise dominated data is calculated using 1-second bins in cleaned event files. If a bin has >2000 counts, and if more than 50% of those come from <1% of pixels, then it is considered to be noise-dominated and hence unusable.
| Quadrant | # 1 sec bins | Bins with >0 counts | Bins with >2000 counts | High rate bins dominated by noise | Noise dominated (total time) | Noise dominated (detector-on time) | Marked lightcurve |
|---|---|---|---|---|---|---|---|
| A | 80115 | 70510 | 38 | 38 | 0.05% | 0.05% |  |
| B | 80115 | 70511 | 259 | 259 | 0.32% | 0.37% |  |
| C | 80115 | 70511 | 57 | 57 | 0.07% | 0.08% |  |
| D | 80116 | 70509 | 1501 | 1501 | 1.87% | 2.13% |  |
Top three noisy pixels from each quadrant. If the there are fewer than three noisy pixels in the level2.evt file, extra rows are filled as -1
| Pixel properties | Quadrant properties | ||||||
|---|---|---|---|---|---|---|---|
| Quadrant | DetID | PixID | Counts | Sigma | Mean | Median | Sigma |
| A | 6 | 16 | 228248 | 275.86 | 3726 | 3657 | 814.1 |
| A | 13 | 254 | 102467 | 121.37 | 3726 | 3657 | 814.1 |
| A | 2 | 79 | 63138 | 73.06 | 3726 | 3657 | 814.1 |
| B | 3 | 64 | 1028341 | 1428.16 | 3772 | 3677 | 717.5 |
| B | 4 | 216 | 614698 | 851.63 | 3772 | 3677 | 717.5 |
| B | 0 | 189 | 327317 | 451.08 | 3772 | 3677 | 717.5 |
| C | 10 | 9 | 686814 | 795.02 | 3604 | 3594 | 859.4 |
| C | 0 | 10 | 474889 | 548.41 | 3604 | 3594 | 859.4 |
| C | 0 | 207 | 275708 | 316.64 | 3604 | 3594 | 859.4 |
| D | 1 | 52 | 9797226 | 11528.54 | 3591 | 3474 | 849.5 |
| D | 13 | 153 | 1300714 | 1527.02 | 3591 | 3474 | 849.5 |
| D | 13 | 172 | 1161049 | 1362.62 | 3591 | 3474 | 849.5 |
Histogram calculated using DETX and DETY for each event in the final _common_clean file
| Quadrant A | 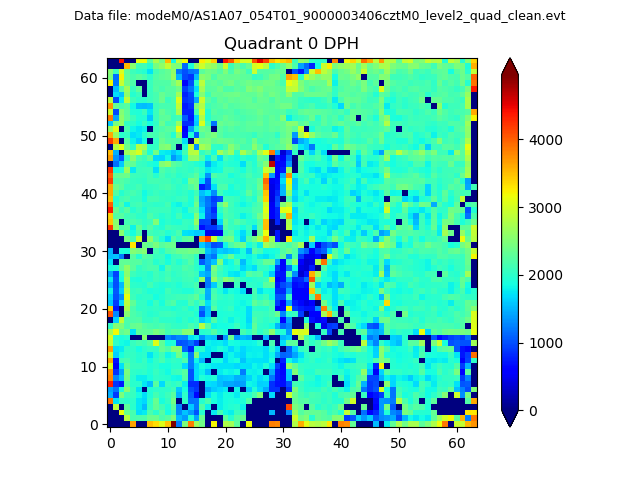 |
 |
Quadrant B |
|---|---|---|---|
| Quadrant D |  |
 |
Quadrant C |
| Plot type | Count rate plots | Images |
|---|---|---|
| Comparison with Poisson distribution Blue bars denote a histogram of data divided into 1 sec bins. Red curve is a Poisson curve with rate = median count rate of data. |
 |
 |
| Quadrant-wise count rates Data is divided into 100 sec bins |
 |
|
| Module-wise count rates for Quadrant A Data is divided into 100 sec bins |
 |
 |
| Module-wise count rates for Quadrant B Data is divided into 100 sec bins |
 |
 |
| Module-wise count rates for Quadrant C Data is divided into 100 sec bins |
 |
 |
| Module-wise count rates for Quadrant D Data is divided into 100 sec bins |
 |
 |
| Parameter | Plot |
|---|---|
| CZT HV Monitor |  |
| D_VDD |  |
| Temperature 1 |  |
| Veto HV Monitor |  |
| Veto LLD |  |
| Alpha Counter |  |
| _CPM_Rate |  |
| CZT Counter |  |
| +2.5 Volts monitor |  |
| +5 Volts monitor | 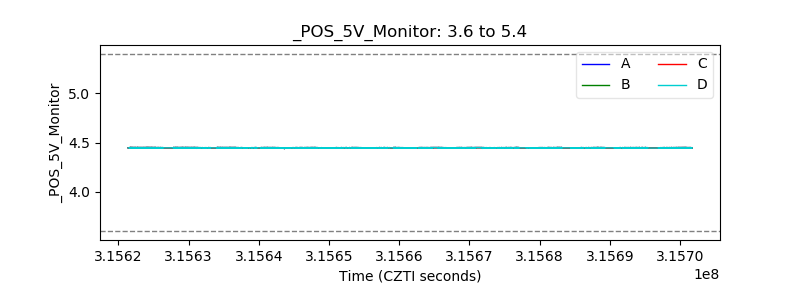 |
| _ROLL_ROT | 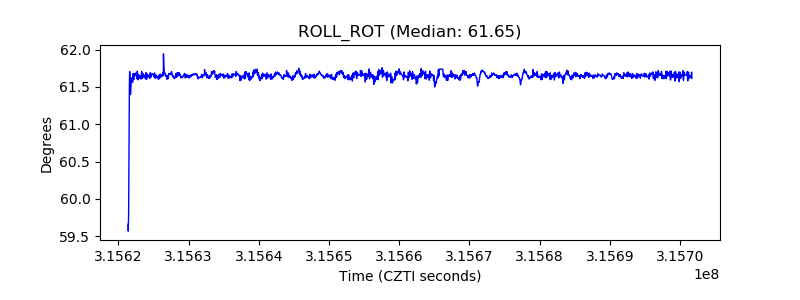 |
| _Roll_DEC |  |
| _Roll_RA |  |
| Veto Counter | 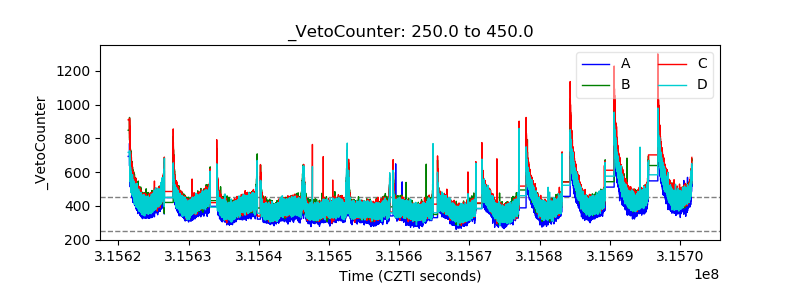 |