| Param | Original file | Final file |
|---|---|---|
| Filename | modeM0/AS1C05_004T01_9000003404cztM0_level2_bc.evt | modeM0/AS1C05_004T01_9000003404cztM0_level2_quad_clean.evt |
| Size (bytes) | 5,662,310,400 | 2,252,623,680 |
| Size | 5.3 GB | 2.1 GB |
| Events in quadrant A | 30,318,200 | 14,829,348 |
| Events in quadrant B | 34,398,640 | 15,057,913 |
| Events in quadrant C | 32,017,927 | 14,411,064 |
| Events in quadrant D | 64,668,732 | 13,788,530 |
| Mode M0 | |||
|---|---|---|---|
| Quadrant | BADHDUFLAG | Total packets | Discarded packets |
| A | 0 | 304536 | 0 |
| B | 0 | 317465 | 0 |
| C | 0 | 313821 | 0 |
| D | 0 | 415626 | 0 |
| Mode SS | |||
|---|---|---|---|
| Quadrant | BADHDUFLAG | Total packets | Discarded packets |
| A | 0 | 3014 | 0 |
| B | 0 | 3014 | 0 |
| C | 0 | 3014 | 0 |
| D | 0 | 3014 | 0 |
| Mode M9 | |||
|---|---|---|---|
| Quadrant | BADHDUFLAG | Total packets | Discarded packets |
| A | 0 | 239 | 0 |
| B | 0 | 239 | 0 |
| C | 0 | 239 | 0 |
| D | 0 | 239 | 0 |
| Quadrant | Total seconds | Saturated seconds | Saturation percentage |
|---|---|---|---|
| A | 148119 | 1671 | 1.128147% |
| B | 148117 | 2907 | 1.962638% |
| C | 148119 | 2925 | 1.974764% |
| D | 148119 | 6481 | 4.375536% |
Noise dominated data is calculated using 1-second bins in cleaned event files. If a bin has >2000 counts, and if more than 50% of those come from <1% of pixels, then it is considered to be noise-dominated and hence unusable.
| Quadrant | # 1 sec bins | Bins with >0 counts | Bins with >2000 counts | High rate bins dominated by noise | Noise dominated (total time) | Noise dominated (detector-on time) | Marked lightcurve |
|---|---|---|---|---|---|---|---|
| A | 171394 | 148124 | 1 | 1 | 0.00% | 0.00% |  |
| B | 171394 | 148122 | 426 | 426 | 0.25% | 0.29% |  |
| C | 171394 | 148123 | 191 | 191 | 0.11% | 0.13% | 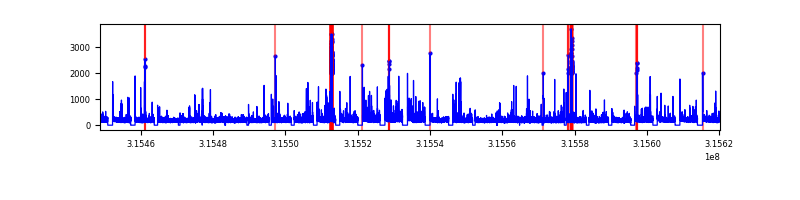 |
| D | 171394 | 148123 | 1157 | 1157 | 0.68% | 0.78% |  |
Top three noisy pixels from each quadrant. If the there are fewer than three noisy pixels in the level2.evt file, extra rows are filled as -1
| Pixel properties | Quadrant properties | ||||||
|---|---|---|---|---|---|---|---|
| Quadrant | DetID | PixID | Counts | Sigma | Mean | Median | Sigma |
| A | 13 | 254 | 204045 | 116.35 | 7797 | 7667 | 1687.8 |
| A | 6 | 16 | 115842 | 64.09 | 7797 | 7667 | 1687.8 |
| A | 11 | 47 | 50254 | 25.23 | 7797 | 7667 | 1687.8 |
| B | 4 | 216 | 2241346 | 1517.06 | 7885 | 7713 | 1472.3 |
| B | 3 | 64 | 582902 | 390.66 | 7885 | 7713 | 1472.3 |
| B | 0 | 189 | 525204 | 351.47 | 7885 | 7713 | 1472.3 |
| C | 10 | 9 | 1004343 | 554.55 | 7572 | 7545 | 1797.5 |
| C | 0 | 207 | 992528 | 547.97 | 7572 | 7545 | 1797.5 |
| C | 0 | 10 | 392285 | 214.04 | 7572 | 7545 | 1797.5 |
| D | 1 | 52 | 22479249 | 12600.72 | 7600 | 7339 | 1783.4 |
| D | 9 | 85 | 2480512 | 1386.79 | 7600 | 7339 | 1783.4 |
| D | 13 | 172 | 1849135 | 1032.75 | 7600 | 7339 | 1783.4 |
Histogram calculated using DETX and DETY for each event in the final _common_clean file
| Quadrant A |  |
 |
Quadrant B |
|---|---|---|---|
| Quadrant D |  |
 |
Quadrant C |
| Plot type | Count rate plots | Images |
|---|---|---|
| Comparison with Poisson distribution Blue bars denote a histogram of data divided into 1 sec bins. Red curve is a Poisson curve with rate = median count rate of data. |
 |
 |
| Quadrant-wise count rates Data is divided into 100 sec bins |
 |
|
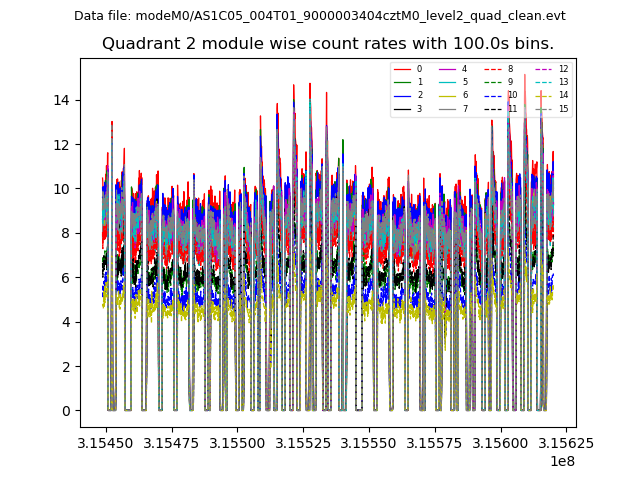
| Module-wise count rates for Quadrant A Data is divided into 100 sec bins |
 |
 |
| Module-wise count rates for Quadrant B Data is divided into 100 sec bins |
 |
 |
| Module-wise count rates for Quadrant C Data is divided into 100 sec bins |
 |
 |
| Module-wise count rates for Quadrant D Data is divided into 100 sec bins |
 |
 |
| Parameter | Plot |
|---|---|
| CZT HV Monitor | 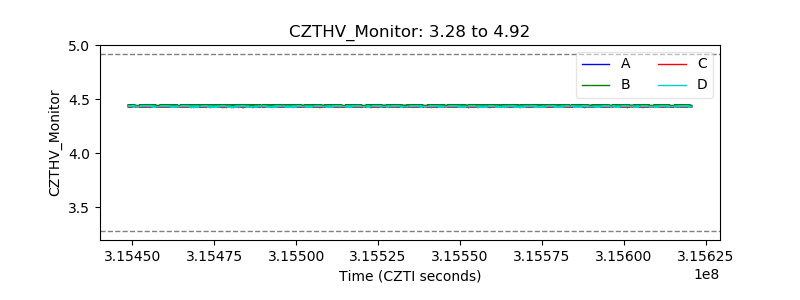 |
| D_VDD |  |
| Temperature 1 |  |
| Veto HV Monitor |  |
| Veto LLD |  |
| Alpha Counter |  |
| _CPM_Rate | 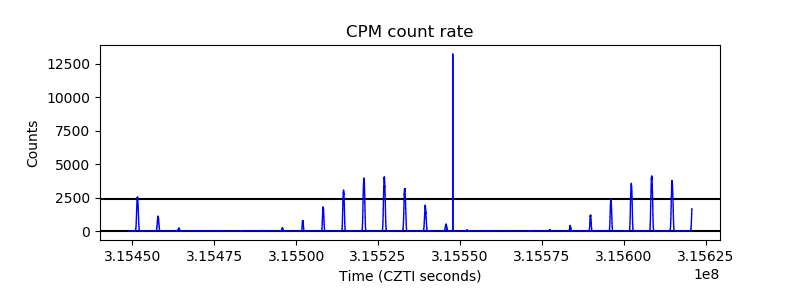 |
| CZT Counter |  |
| +2.5 Volts monitor |  |
| +5 Volts monitor |  |
| _ROLL_ROT |  |
| _Roll_DEC |  |
| _Roll_RA |  |
| Veto Counter |  |