| Param | Original file | Final file |
|---|---|---|
| Filename | modeM0/AS1C05_002T02_9000003402cztM0_level2_bc.evt | modeM0/AS1C05_002T02_9000003402cztM0_level2_quad_clean.evt |
| Size (bytes) | 356,420,160 | 149,385,600 |
| Size | 339.9 MB | 142.5 MB |
| Events in quadrant A | 2,035,356 | 1,011,983 |
| Events in quadrant B | 2,145,941 | 1,048,638 |
| Events in quadrant C | 2,065,153 | 996,682 |
| Events in quadrant D | 3,948,365 | 863,947 |
| Mode SS | |||
|---|---|---|---|
| Quadrant | BADHDUFLAG | Total packets | Discarded packets |
| A | 0 | 176 | 0 |
| B | 0 | 176 | 0 |
| C | 0 | 176 | 0 |
| D | 0 | 176 | 0 |
| Mode M0 | |||
|---|---|---|---|
| Quadrant | BADHDUFLAG | Total packets | Discarded packets |
| A | 0 | 18704 | 0 |
| B | 0 | 19082 | 0 |
| C | 0 | 19144 | 0 |
| D | 0 | 28316 | 0 |
| Mode M9 | |||
|---|---|---|---|
| Quadrant | BADHDUFLAG | Total packets | Discarded packets |
| A | 0 | 28 | 0 |
| B | 0 | 28 | 0 |
| C | 0 | 28 | 0 |
| D | 0 | 28 | 0 |
| Quadrant | Total seconds | Saturated seconds | Saturation percentage |
|---|---|---|---|
| A | 8695 | 47 | 0.540541% |
| B | 8695 | 80 | 0.920069% |
| C | 8695 | 143 | 1.644623% |
| D | 8694 | 1186 | 13.641592% |
Noise dominated data is calculated using 1-second bins in cleaned event files. If a bin has >2000 counts, and if more than 50% of those come from <1% of pixels, then it is considered to be noise-dominated and hence unusable.
| Quadrant | # 1 sec bins | Bins with >0 counts | Bins with >2000 counts | High rate bins dominated by noise | Noise dominated (total time) | Noise dominated (detector-on time) | Marked lightcurve |
|---|---|---|---|---|---|---|---|
| A | 11405 | 8695 | 0 | 0 | 0.00% | 0.00% | 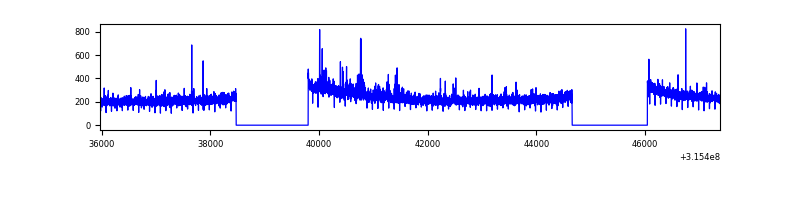 |
| B | 11405 | 8696 | 5 | 5 | 0.04% | 0.06% |  |
| C | 11405 | 8695 | 9 | 9 | 0.08% | 0.10% |  |
| D | 11404 | 8687 | 162 | 162 | 1.42% | 1.86% | 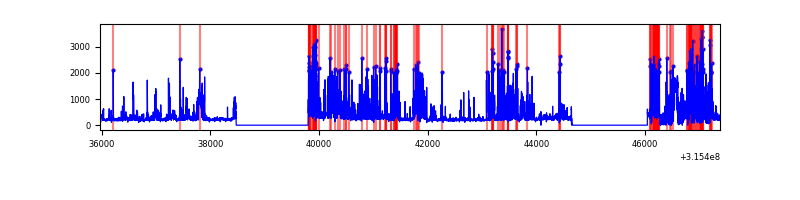 |
Top three noisy pixels from each quadrant. If the there are fewer than three noisy pixels in the level2.evt file, extra rows are filled as -1
| Pixel properties | Quadrant properties | ||||||
|---|---|---|---|---|---|---|---|
| Quadrant | DetID | PixID | Counts | Sigma | Mean | Median | Sigma |
| A | 11 | 47 | 47272 | 422.48 | 513 | 505 | 110.7 |
| A | 13 | 254 | 10848 | 93.44 | 513 | 505 | 110.7 |
| A | 6 | 16 | 10653 | 91.67 | 513 | 505 | 110.7 |
| B | 4 | 216 | 76734 | 767.65 | 526 | 516 | 99.3 |
| B | 0 | 189 | 35793 | 355.3 | 526 | 516 | 99.3 |
| B | 4 | 173 | 8199 | 77.38 | 526 | 516 | 99.3 |
| C | 10 | 9 | 105611 | 899.95 | 501 | 500 | 116.8 |
| C | 0 | 10 | 9743 | 79.13 | 501 | 500 | 116.8 |
| C | 7 | 247 | 8778 | 70.87 | 501 | 500 | 116.8 |
| D | 1 | 52 | 1852571 | 17245.35 | 457 | 441 | 107.4 |
| D | 13 | 174 | 166004 | 1541.57 | 457 | 441 | 107.4 |
| D | 13 | 153 | 126126 | 1170.26 | 457 | 441 | 107.4 |
Histogram calculated using DETX and DETY for each event in the final _common_clean file
| Quadrant A |  |
 |
Quadrant B |
|---|---|---|---|
| Quadrant D | 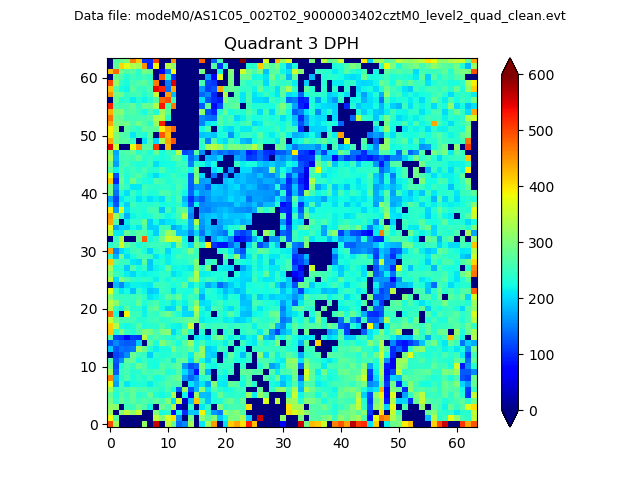 |
 |
Quadrant C |
| Plot type | Count rate plots | Images |
|---|---|---|
| Comparison with Poisson distribution Blue bars denote a histogram of data divided into 1 sec bins. Red curve is a Poisson curve with rate = median count rate of data. |
 |
 |
| Quadrant-wise count rates Data is divided into 100 sec bins |
 |
|
| Module-wise count rates for Quadrant A Data is divided into 100 sec bins |
 |
 |
| Module-wise count rates for Quadrant B Data is divided into 100 sec bins |
 |
 |
| Module-wise count rates for Quadrant C Data is divided into 100 sec bins |
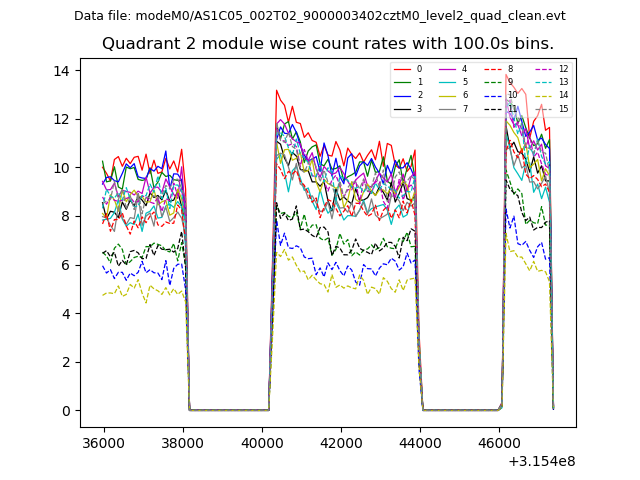 |
 |
| Module-wise count rates for Quadrant D Data is divided into 100 sec bins |
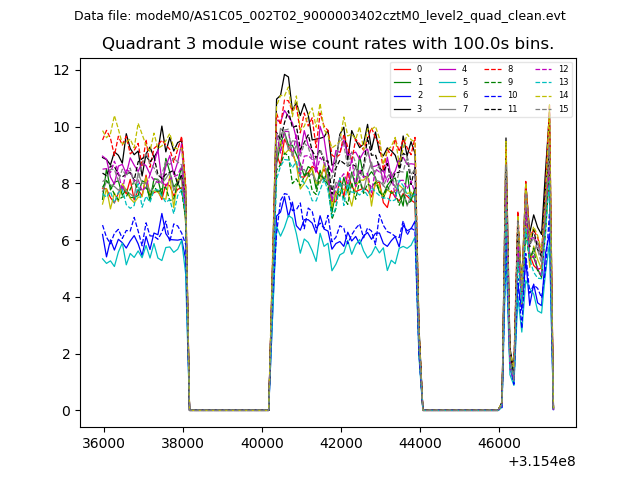 |
 |
| Parameter | Plot |
|---|---|
| CZT HV Monitor |  |
| D_VDD |  |
| Temperature 1 |  |
| Veto HV Monitor |  |
| Veto LLD |  |
| Alpha Counter |  |
| _CPM_Rate |  |
| CZT Counter |  |
| +2.5 Volts monitor |  |
| +5 Volts monitor |  |
| _ROLL_ROT |  |
| _Roll_DEC |  |
| _Roll_RA | 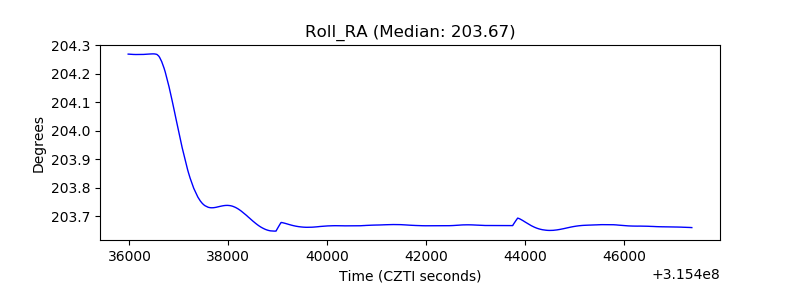 |
| Veto Counter |  |