| Param | Original file | Final file |
|---|---|---|
| Filename | modeM0/AS1C05_013T01_9000003398cztM0_level2_bc.evt | modeM0/AS1C05_013T01_9000003398cztM0_level2_quad_clean.evt |
| Size (bytes) | 346,616,640 | 199,088,640 |
| Size | 330.6 MB | 189.9 MB |
| Events in quadrant A | 2,101,751 | 1,351,045 |
| Events in quadrant B | 2,283,774 | 1,371,772 |
| Events in quadrant C | 2,027,446 | 1,309,626 |
| Events in quadrant D | 3,358,587 | 1,268,217 |
| Mode M9 | |||
|---|---|---|---|
| Quadrant | BADHDUFLAG | Total packets | Discarded packets |
| A | 0 | 6 | 0 |
| B | 0 | 6 | 0 |
| C | 0 | 6 | 0 |
| D | 0 | 6 | 0 |
| Mode M0 | |||
|---|---|---|---|
| Quadrant | BADHDUFLAG | Total packets | Discarded packets |
| A | 0 | 21393 | 0 |
| B | 0 | 21802 | 0 |
| C | 0 | 21395 | 0 |
| D | 0 | 25604 | 0 |
| Mode SS | |||
|---|---|---|---|
| Quadrant | BADHDUFLAG | Total packets | Discarded packets |
| A | 0 | 212 | 0 |
| B | 0 | 212 | 0 |
| C | 0 | 212 | 0 |
| D | 0 | 212 | 0 |
| Quadrant | Total seconds | Saturated seconds | Saturation percentage |
|---|---|---|---|
| A | 10540 | 77 | 0.730550% |
| B | 10540 | 93 | 0.882353% |
| C | 10540 | 105 | 0.996205% |
| D | 10540 | 264 | 2.504744% |
Noise dominated data is calculated using 1-second bins in cleaned event files. If a bin has >2000 counts, and if more than 50% of those come from <1% of pixels, then it is considered to be noise-dominated and hence unusable.
| Quadrant | # 1 sec bins | Bins with >0 counts | Bins with >2000 counts | High rate bins dominated by noise | Noise dominated (total time) | Noise dominated (detector-on time) | Marked lightcurve |
|---|---|---|---|---|---|---|---|
| A | 11040 | 10540 | 0 | 0 | 0.00% | 0.00% | 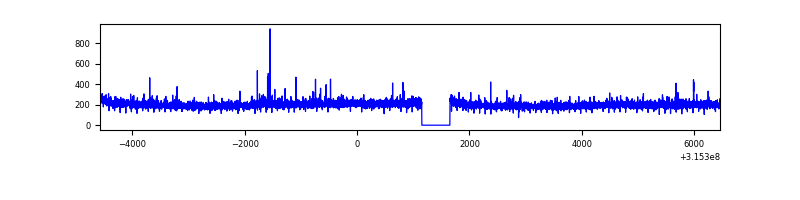 |
| B | 11039 | 10539 | 2 | 2 | 0.02% | 0.02% |  |
| C | 11039 | 10539 | 0 | 0 | 0.00% | 0.00% | 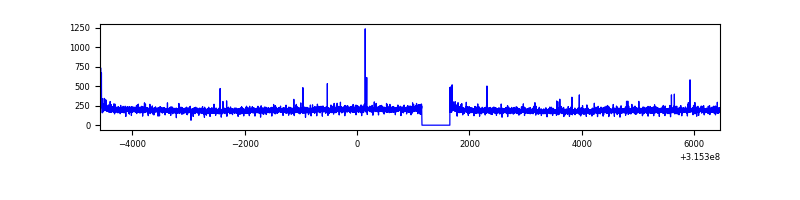 |
| D | 11039 | 10539 | 30 | 30 | 0.27% | 0.28% |  |
Top three noisy pixels from each quadrant. If the there are fewer than three noisy pixels in the level2.evt file, extra rows are filled as -1
| Pixel properties | Quadrant properties | ||||||
|---|---|---|---|---|---|---|---|
| Quadrant | DetID | PixID | Counts | Sigma | Mean | Median | Sigma |
| A | 13 | 254 | 15462 | 123.17 | 540 | 530 | 121.2 |
| A | 14 | 237 | 11834 | 93.24 | 540 | 530 | 121.2 |
| A | 13 | 170 | 3686 | 26.03 | 540 | 530 | 121.2 |
| B | 0 | 189 | 76081 | 712.05 | 545 | 531 | 106.1 |
| B | 0 | 190 | 74191 | 694.23 | 545 | 531 | 106.1 |
| B | 5 | 172 | 21122 | 194.07 | 545 | 531 | 106.1 |
| C | 0 | 10 | 12006 | 92.34 | 520 | 517 | 124.4 |
| C | 7 | 247 | 7665 | 57.45 | 520 | 517 | 124.4 |
| C | 13 | 61 | 3048 | 20.34 | 520 | 517 | 124.4 |
| D | 1 | 52 | 455074 | 3611.61 | 528 | 509 | 125.9 |
| D | 13 | 104 | 138487 | 1096.26 | 528 | 509 | 125.9 |
| D | 13 | 249 | 120545 | 953.71 | 528 | 509 | 125.9 |
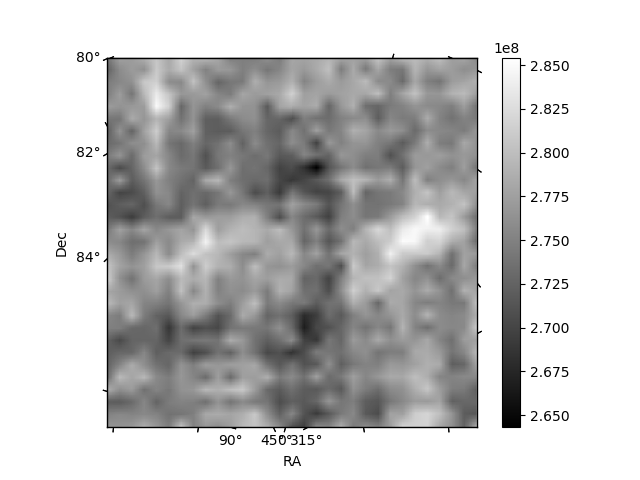
Histogram calculated using DETX and DETY for each event in the final _common_clean file
| Quadrant A |  |
 |
Quadrant B |
|---|---|---|---|
| Quadrant D |  |
 |
Quadrant C |
| Plot type | Count rate plots | Images |
|---|---|---|
| Comparison with Poisson distribution Blue bars denote a histogram of data divided into 1 sec bins. Red curve is a Poisson curve with rate = median count rate of data. |
 |
 |
| Quadrant-wise count rates Data is divided into 100 sec bins |
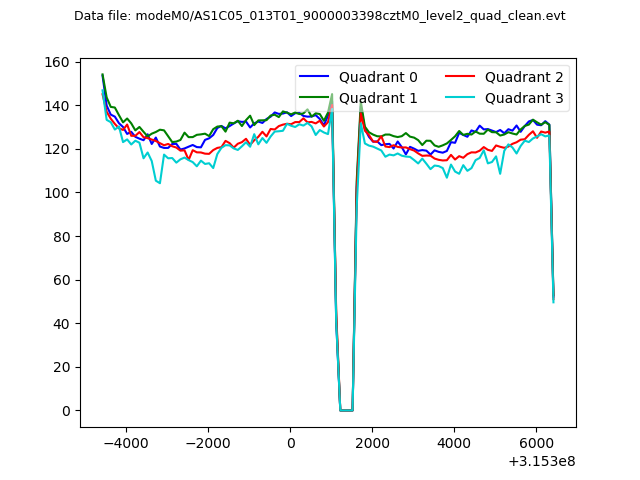 |
|
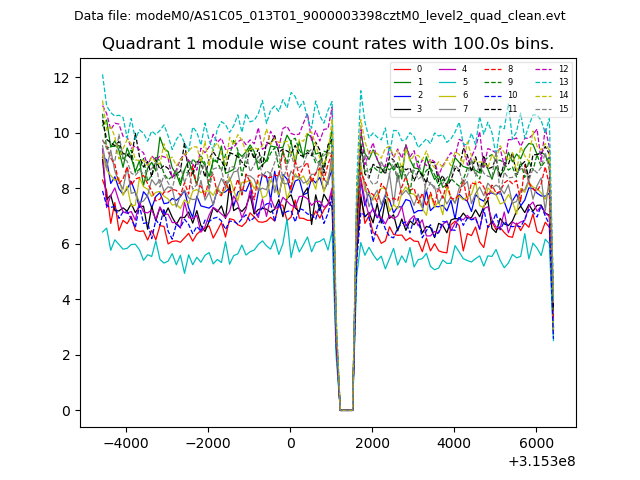
| Module-wise count rates for Quadrant A Data is divided into 100 sec bins |
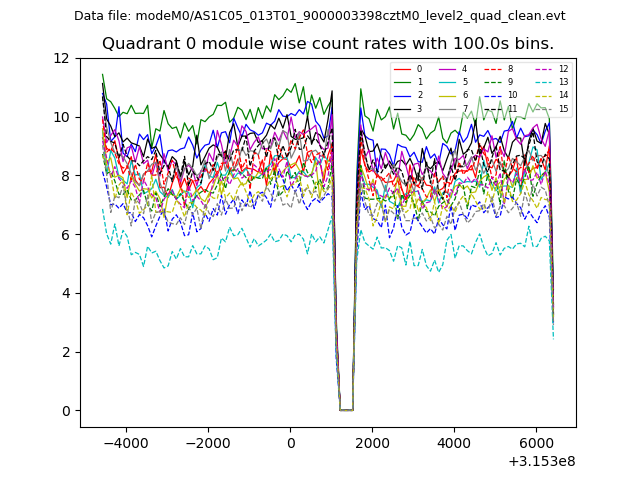 |
 |
| Module-wise count rates for Quadrant B Data is divided into 100 sec bins |
 |
 |
| Module-wise count rates for Quadrant C Data is divided into 100 sec bins |
 |
 |
| Module-wise count rates for Quadrant D Data is divided into 100 sec bins |
 |
 |
| Parameter | Plot |
|---|---|
| CZT HV Monitor |  |
| D_VDD |  |
| Temperature 1 | 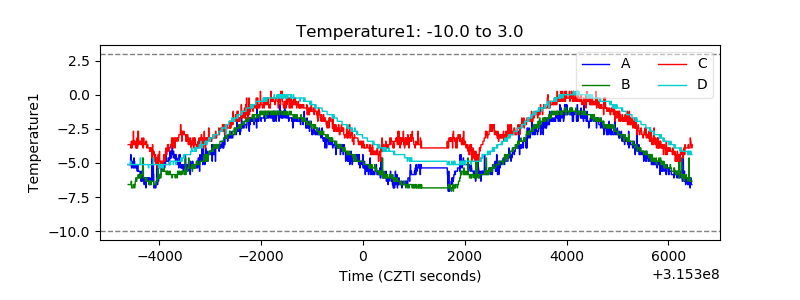 |
| Veto HV Monitor |  |
| Veto LLD |  |
| Alpha Counter |  |
| _CPM_Rate |  |
| CZT Counter |  |
| +2.5 Volts monitor |  |
| +5 Volts monitor |  |
| _ROLL_ROT |  |
| _Roll_DEC |  |
| _Roll_RA |  |
| Veto Counter |  |