| Param | Original file | Final file |
|---|---|---|
| Filename | modeM0/AS1A08_004T03_9000003400cztM0_level2_bc.evt | modeM0/AS1A08_004T03_9000003400cztM0_level2_quad_clean.evt |
| Size (bytes) | 3,902,267,520 | 1,340,634,240 |
| Size | 3.6 GB | 1.2 GB |
| Events in quadrant A | 22,211,949 | 8,510,374 |
| Events in quadrant B | 24,101,659 | 8,636,567 |
| Events in quadrant C | 23,915,315 | 8,200,959 |
| Events in quadrant D | 40,671,558 | 7,933,319 |
| Mode M0 | |||
|---|---|---|---|
| Quadrant | BADHDUFLAG | Total packets | Discarded packets |
| A | 0 | 221349 | 0 |
| B | 0 | 227356 | 0 |
| C | 0 | 229962 | 0 |
| D | 0 | 280600 | 0 |
| Mode SS | |||
|---|---|---|---|
| Quadrant | BADHDUFLAG | Total packets | Discarded packets |
| A | 0 | 2180 | 0 |
| B | 0 | 2180 | 0 |
| C | 0 | 2180 | 0 |
| D | 0 | 2180 | 0 |
| Mode M9 | |||
|---|---|---|---|
| Quadrant | BADHDUFLAG | Total packets | Discarded packets |
| A | 0 | 167 | 0 |
| B | 0 | 168 | 0 |
| C | 0 | 168 | 0 |
| D | 0 | 168 | 0 |
| Quadrant | Total seconds | Saturated seconds | Saturation percentage |
|---|---|---|---|
| A | 106886 | 1188 | 1.111465% |
| B | 106886 | 1801 | 1.684973% |
| C | 106885 | 2434 | 2.277214% |
| D | 106885 | 3731 | 3.490668% |
Noise dominated data is calculated using 1-second bins in cleaned event files. If a bin has >2000 counts, and if more than 50% of those come from <1% of pixels, then it is considered to be noise-dominated and hence unusable.
| Quadrant | # 1 sec bins | Bins with >0 counts | Bins with >2000 counts | High rate bins dominated by noise | Noise dominated (total time) | Noise dominated (detector-on time) | Marked lightcurve |
|---|---|---|---|---|---|---|---|
| A | 127549 | 106892 | 1 | 1 | 0.00% | 0.00% |  |
| B | 127549 | 106889 | 138 | 138 | 0.11% | 0.13% |  |
| C | 127549 | 106888 | 156 | 156 | 0.12% | 0.15% |  |
| D | 127549 | 106888 | 778 | 778 | 0.61% | 0.73% |  |
Top three noisy pixels from each quadrant. If the there are fewer than three noisy pixels in the level2.evt file, extra rows are filled as -1
| Pixel properties | Quadrant properties | ||||||
|---|---|---|---|---|---|---|---|
| Quadrant | DetID | PixID | Counts | Sigma | Mean | Median | Sigma |
| A | 11 | 47 | 285714 | 228.23 | 5666 | 5565 | 1227.5 |
| A | 13 | 254 | 149305 | 117.1 | 5666 | 5565 | 1227.5 |
| A | 14 | 237 | 37577 | 26.08 | 5666 | 5565 | 1227.5 |
| B | 4 | 216 | 812864 | 754.12 | 5730 | 5592 | 1070.5 |
| B | 0 | 189 | 656312 | 607.88 | 5730 | 5592 | 1070.5 |
| B | 0 | 190 | 276765 | 253.32 | 5730 | 5592 | 1070.5 |
| C | 9 | 15 | 1507698 | 1166.54 | 5463 | 5440 | 1287.8 |
| C | 10 | 9 | 413174 | 316.62 | 5463 | 5440 | 1287.8 |
| C | 10 | 223 | 409145 | 313.49 | 5463 | 5440 | 1287.8 |
| D | 1 | 52 | 9648993 | 7507.0 | 5523 | 5330 | 1284.6 |
| D | 12 | 227 | 2962762 | 2302.18 | 5523 | 5330 | 1284.6 |
| D | 13 | 174 | 2425818 | 1884.2 | 5523 | 5330 | 1284.6 |
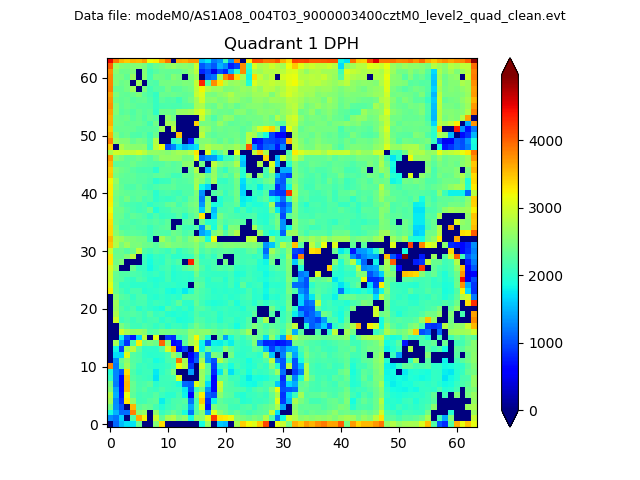
Histogram calculated using DETX and DETY for each event in the final _common_clean file
| Quadrant A |  |
 |
Quadrant B |
|---|---|---|---|
| Quadrant D |  |
 |
Quadrant C |
| Plot type | Count rate plots | Images |
|---|---|---|
| Comparison with Poisson distribution Blue bars denote a histogram of data divided into 1 sec bins. Red curve is a Poisson curve with rate = median count rate of data. |
 |
 |
| Quadrant-wise count rates Data is divided into 100 sec bins |
 |
|
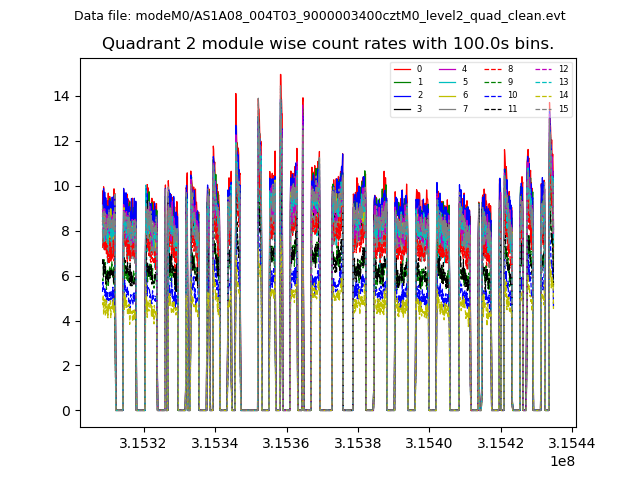
| Module-wise count rates for Quadrant A Data is divided into 100 sec bins |
 |
 |
| Module-wise count rates for Quadrant B Data is divided into 100 sec bins |
 |
 |
| Module-wise count rates for Quadrant C Data is divided into 100 sec bins |
 |
 |
| Module-wise count rates for Quadrant D Data is divided into 100 sec bins |
 |
 |
| Parameter | Plot |
|---|---|
| CZT HV Monitor |  |
| D_VDD |  |
| Temperature 1 |  |
| Veto HV Monitor |  |
| Veto LLD | 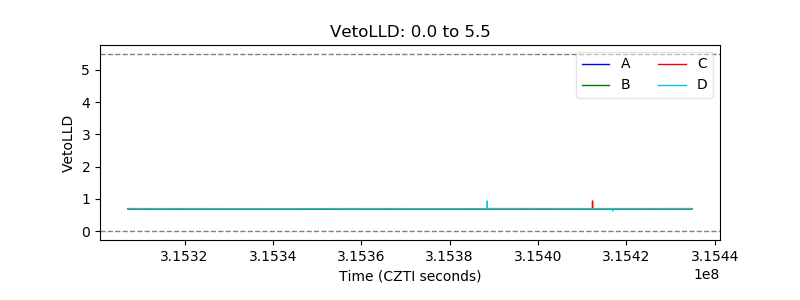 |
| Alpha Counter |  |
| _CPM_Rate | 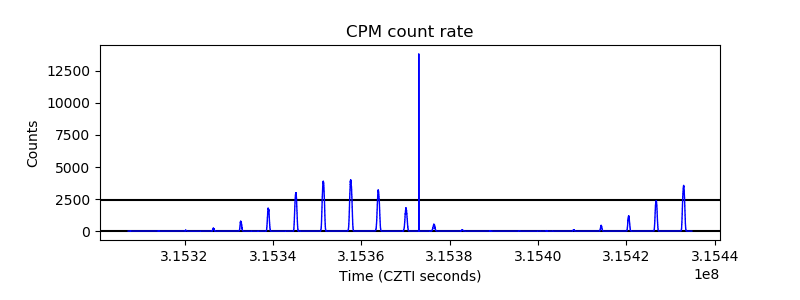 |
| CZT Counter |  |
| +2.5 Volts monitor |  |
| +5 Volts monitor |  |
| _ROLL_ROT | 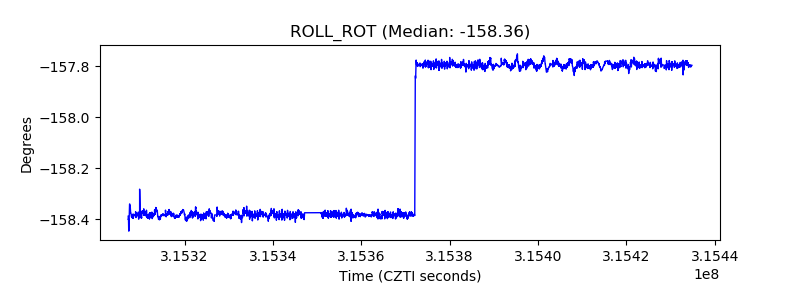 |
| _Roll_DEC |  |
| _Roll_RA |  |
| Veto Counter |  |