| Param | Original file | Final file |
|---|---|---|
| Filename | modeM0/AS1A07_047T09_9000003396cztM0_level2_bc.evt | modeM0/AS1A07_047T09_9000003396cztM0_level2_quad_clean.evt |
| Size (bytes) | 1,023,111,360 | 446,474,880 |
| Size | 975.7 MB | 425.8 MB |
| Events in quadrant A | 6,084,160 | 2,964,758 |
| Events in quadrant B | 6,658,366 | 3,041,278 |
| Events in quadrant C | 6,024,736 | 2,931,230 |
| Events in quadrant D | 10,412,606 | 2,769,273 |
| Mode SS | |||
|---|---|---|---|
| Quadrant | BADHDUFLAG | Total packets | Discarded packets |
| A | 0 | 538 | 0 |
| B | 0 | 538 | 0 |
| C | 0 | 538 | 0 |
| D | 0 | 538 | 0 |
| Mode M0 | |||
|---|---|---|---|
| Quadrant | BADHDUFLAG | Total packets | Discarded packets |
| A | 0 | 54865 | 0 |
| B | 0 | 57152 | 0 |
| C | 0 | 55568 | 0 |
| D | 0 | 71357 | 0 |
| Mode M9 | |||
|---|---|---|---|
| Quadrant | BADHDUFLAG | Total packets | Discarded packets |
| A | 0 | 63 | 0 |
| B | 0 | 63 | 0 |
| C | 0 | 63 | 0 |
| D | 0 | 63 | 0 |
| Quadrant | Total seconds | Saturated seconds | Saturation percentage |
|---|---|---|---|
| A | 26433 | 175 | 0.662051% |
| B | 26433 | 297 | 1.123596% |
| C | 26433 | 373 | 1.411115% |
| D | 26433 | 1131 | 4.278742% |
Noise dominated data is calculated using 1-second bins in cleaned event files. If a bin has >2000 counts, and if more than 50% of those come from <1% of pixels, then it is considered to be noise-dominated and hence unusable.
| Quadrant | # 1 sec bins | Bins with >0 counts | Bins with >2000 counts | High rate bins dominated by noise | Noise dominated (total time) | Noise dominated (detector-on time) | Marked lightcurve |
|---|---|---|---|---|---|---|---|
| A | 32763 | 26434 | 2 | 2 | 0.01% | 0.01% | 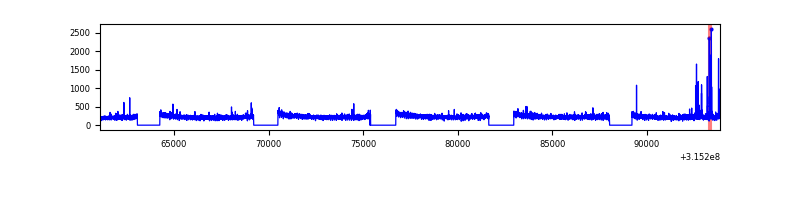 |
| B | 32763 | 26434 | 1 | 1 | 0.00% | 0.00% |  |
| C | 32763 | 26434 | 1 | 1 | 0.00% | 0.00% |  |
| D | 32763 | 26432 | 184 | 184 | 0.56% | 0.70% |  |
Top three noisy pixels from each quadrant. If the there are fewer than three noisy pixels in the level2.evt file, extra rows are filled as -1
| Pixel properties | Quadrant properties | ||||||
|---|---|---|---|---|---|---|---|
| Quadrant | DetID | PixID | Counts | Sigma | Mean | Median | Sigma |
| A | 14 | 237 | 60363 | 178.25 | 1549 | 1530 | 330.1 |
| A | 4 | 2 | 44231 | 129.37 | 1549 | 1530 | 330.1 |
| A | 13 | 254 | 40039 | 116.67 | 1549 | 1530 | 330.1 |
| B | 0 | 190 | 220086 | 757.32 | 1580 | 1554 | 288.6 |
| B | 0 | 189 | 191828 | 659.4 | 1580 | 1554 | 288.6 |
| B | 3 | 209 | 75267 | 255.45 | 1580 | 1554 | 288.6 |
| C | 7 | 247 | 147962 | 414.36 | 1515 | 1519 | 353.4 |
| C | 0 | 10 | 49513 | 135.8 | 1515 | 1519 | 353.4 |
| C | 13 | 61 | 8766 | 20.51 | 1515 | 1519 | 353.4 |
| D | 1 | 52 | 1848093 | 5315.81 | 1506 | 1463 | 347.4 |
| D | 12 | 227 | 1141476 | 3281.7 | 1506 | 1463 | 347.4 |
| D | 13 | 153 | 508333 | 1459.1 | 1506 | 1463 | 347.4 |
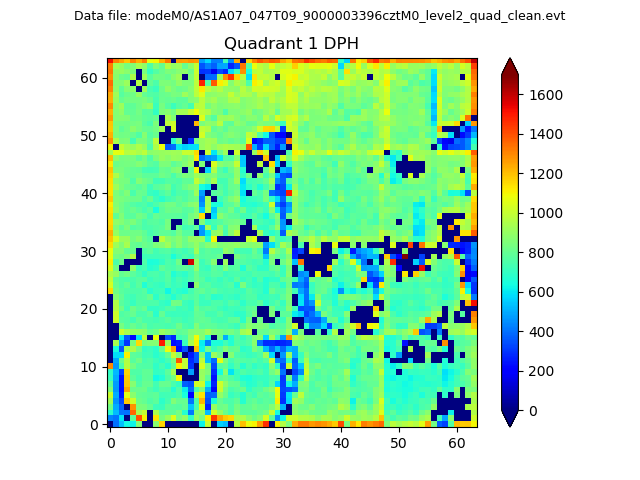
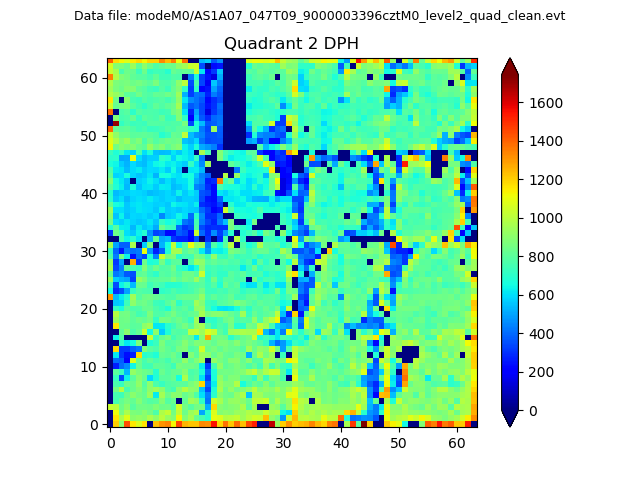
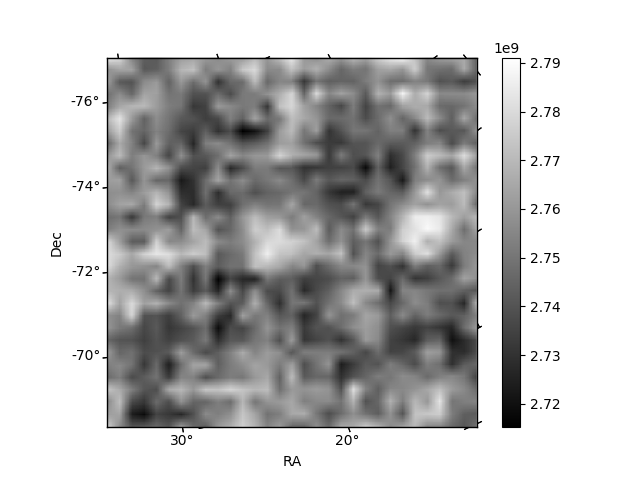
Histogram calculated using DETX and DETY for each event in the final _common_clean file
| Quadrant A |  |
 |
Quadrant B |
|---|---|---|---|
| Quadrant D | 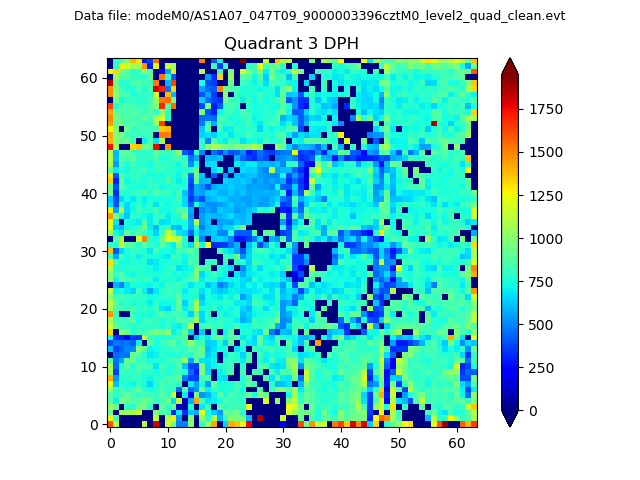 |
 |
Quadrant C |
| Plot type | Count rate plots | Images |
|---|---|---|
| Comparison with Poisson distribution Blue bars denote a histogram of data divided into 1 sec bins. Red curve is a Poisson curve with rate = median count rate of data. |
 |
 |
| Quadrant-wise count rates Data is divided into 100 sec bins |
 |
|
| Module-wise count rates for Quadrant A Data is divided into 100 sec bins |
 |
 |
| Module-wise count rates for Quadrant B Data is divided into 100 sec bins |
 |
 |
| Module-wise count rates for Quadrant C Data is divided into 100 sec bins |
 |
 |
| Module-wise count rates for Quadrant D Data is divided into 100 sec bins |
 |
 |
| Parameter | Plot |
|---|---|
| CZT HV Monitor |  |
| D_VDD | 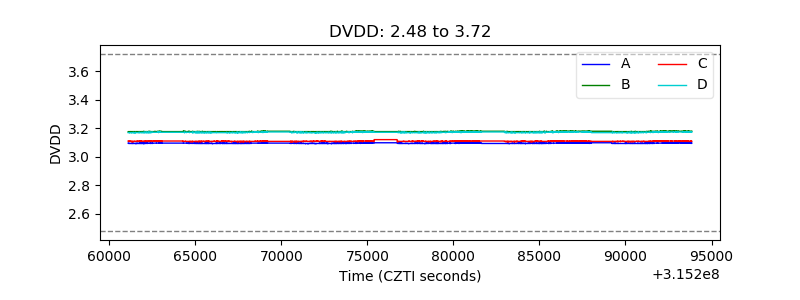 |
| Temperature 1 |  |
| Veto HV Monitor |  |
| Veto LLD |  |
| Alpha Counter | 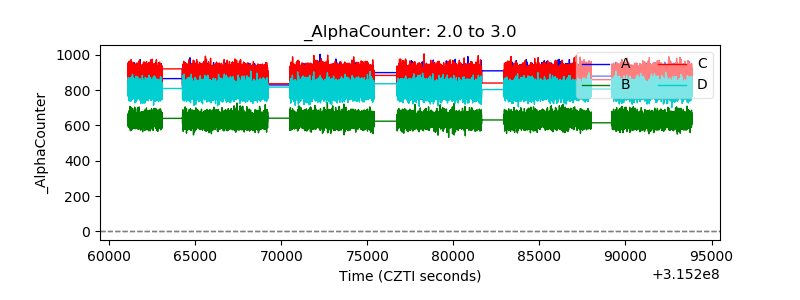 |
| _CPM_Rate |  |
| CZT Counter |  |
| +2.5 Volts monitor |  |
| +5 Volts monitor |  |
| _ROLL_ROT | 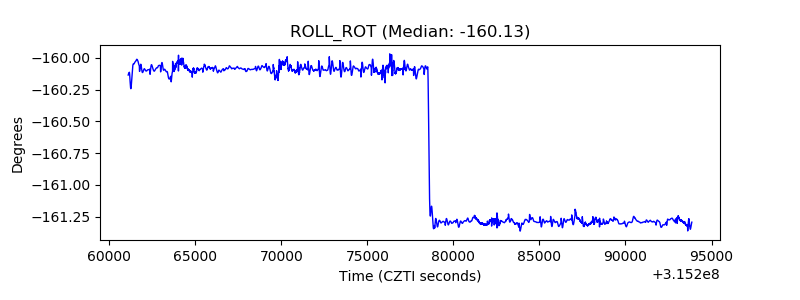 |
| _Roll_DEC |  |
| _Roll_RA |  |
| Veto Counter |  |